




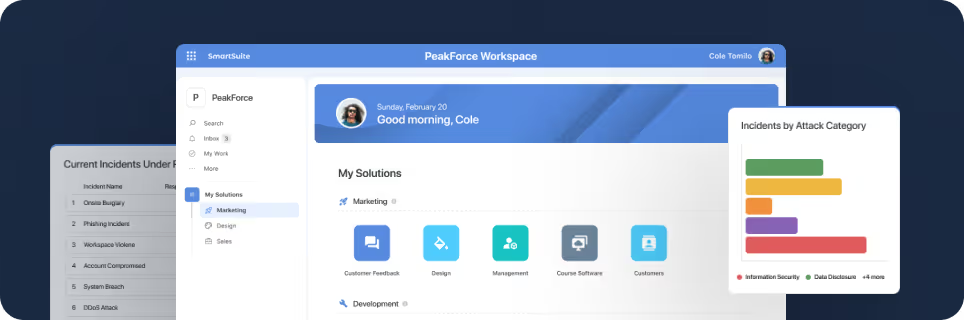
SmartSuite provides work platform for standardizing workflows in the following areas:
- Governance, Risk & Compliance
- IT & Service Ops
- Project / Portfolio Management
- Business Operations

Pivot Tables in Dashboards
A pivot table in a dashboard view is a new SmartSuite feature, available as a widget in dashboard views. In this tutorial we walk through how to use it.
How are the tables set up?
We'll quickly walk through the solution. There are three tables:
- Accounts Table: A list of accounts, from account 1 to account 21.
- Products Table: A list of products, from product 1 to product 30, each with unique price points per unit.
- Sales Table: Acts as a junction table linking accounts to products and recording the date of sale, quantity sold, and the total cost for each sale.
Accounts Table
This table has a list of accounts:

Products Table
This table contains products and their price points:

Sales Table
The Sales table links products to accounts and records sale data:
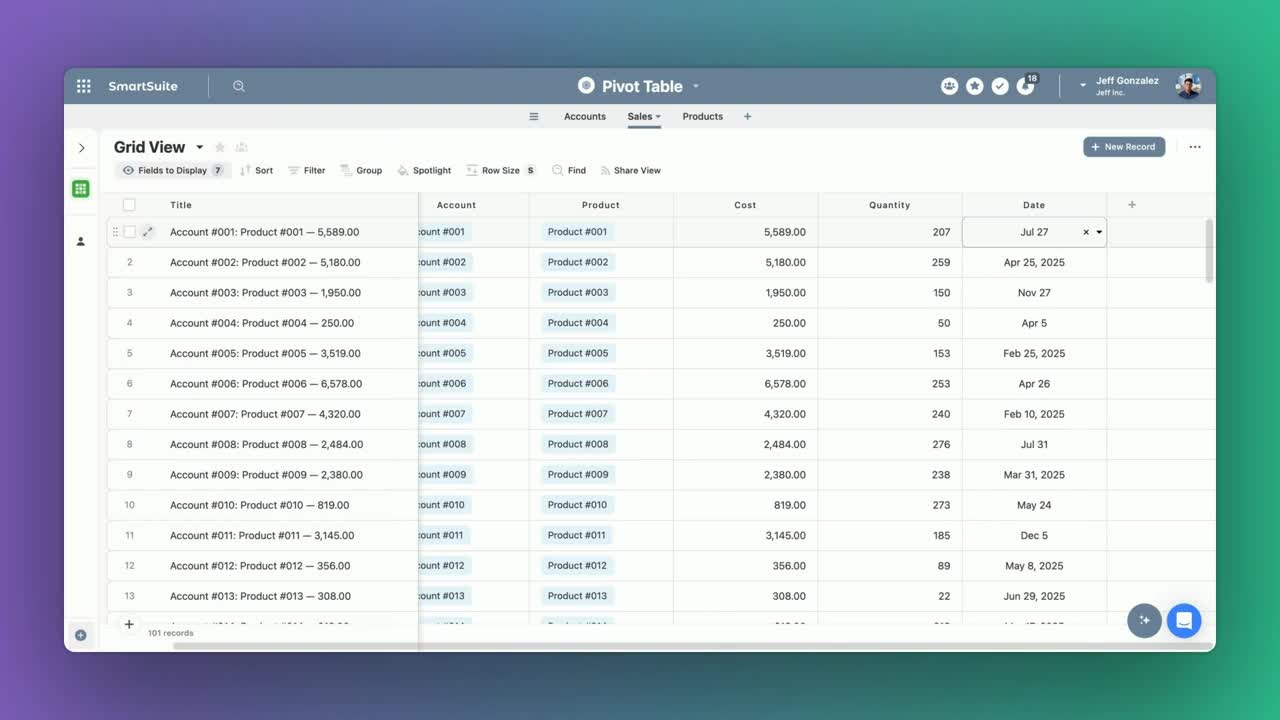
It focuses on the date, quantity sold, and a formula to calculate total cost.
How do you create the pivot table?
Now let's look at the pivot table in a dashboard view.
Opening the Dashboard View
Pivot tables are available in the SmartSuite Views section of the widget library. Select the Pivot Table option.
The configuration settings menu allows you to:
- Title: Name the pivot table
- Description: Add a description
- Solution: Choose the related solution
Set Up the Pivot Table
Let's use the sales table and determine rows and columns:
Setting Rows and Columns
- Rows: Select accounts to see a list of accounts
- Columns: Select products to see what was sold
Use ascending order for better readability:
- Accounts: 1, 2, 3,...
- Products: 1, 2, 3,...

Summary and Assessment
We want to assess the total cost, not just count the sales.
Determine Summary Options
- Field to Assess: Total cost field
- Summary Type:
Sumto total the cost
There are other summary options like max, average, etc. But here we'll sum the total cost of products sold by each account.
Conclusion
Utilizing pivot tables in a dashboard provides a clear way to analyze your data visually.
To experience the future of work management firsthand, start your free SmartSuite trial today!






Put these ideas to work
Start a free trial, or book a demo and see how it runs in SmartSuite.

