SmartSuite reporting is built into every workflow: dashboards, eleven views of the same data, widgets for every level of the organization, and permissions applied to every chart.
Key takeaways
- Dashboards and eleven views (dashboard, grid, card, kanban, calendar, timeline, Gantt, map, forms, chart, document) read the same records.
- Reporting is built for every level: leaders, managers, contributors and members.
- Dashboards combine data across solutions and follow the rhythms of the business.
- Security and governance apply to every chart; a report never shows more than the viewer's permissions allow.
How does reporting work in SmartSuite?
Reporting in SmartSuite reads the live records of each workflow: dashboards combine data across solutions, and eleven views (dashboard, grid, card, kanban, calendar, timeline, Gantt, map, forms, chart and document) present the same records for different jobs. Every chart and widget applies the viewer's permissions.
Dashboards and Reporting Built Into Every Workflow
Bring real-time reporting into every workflow. SmartSuite brings reporting directly into the way work gets done. Dashboards give leaders a clear view across solutions, while views help every team member focus on the slice of work that matters most to them. Because reporting is permission-aware and always live, you can trust that every chart, metric, and list reflects the latest reality, without exporting data into separate tools.
Real-time visibility. See the latest status, metrics, and trends without refreshing, exporting, or rebuilding reports.
Cross-workflow insight. Bring data together from multiple Solutions to understand performance across teams.
Role-aware views. Give every user a view into the work that matches their permissions and responsibilities.
Self-service reporting. Let teams build their own dashboards and views without relying on a separate BI team.
Which views and dashboards are available?
Keep your teams aligned by displaying your data in the view type that best supports the work you are doing. Easily switch between view types with a single click to find the perfect display that's right for you. It really is that easy!
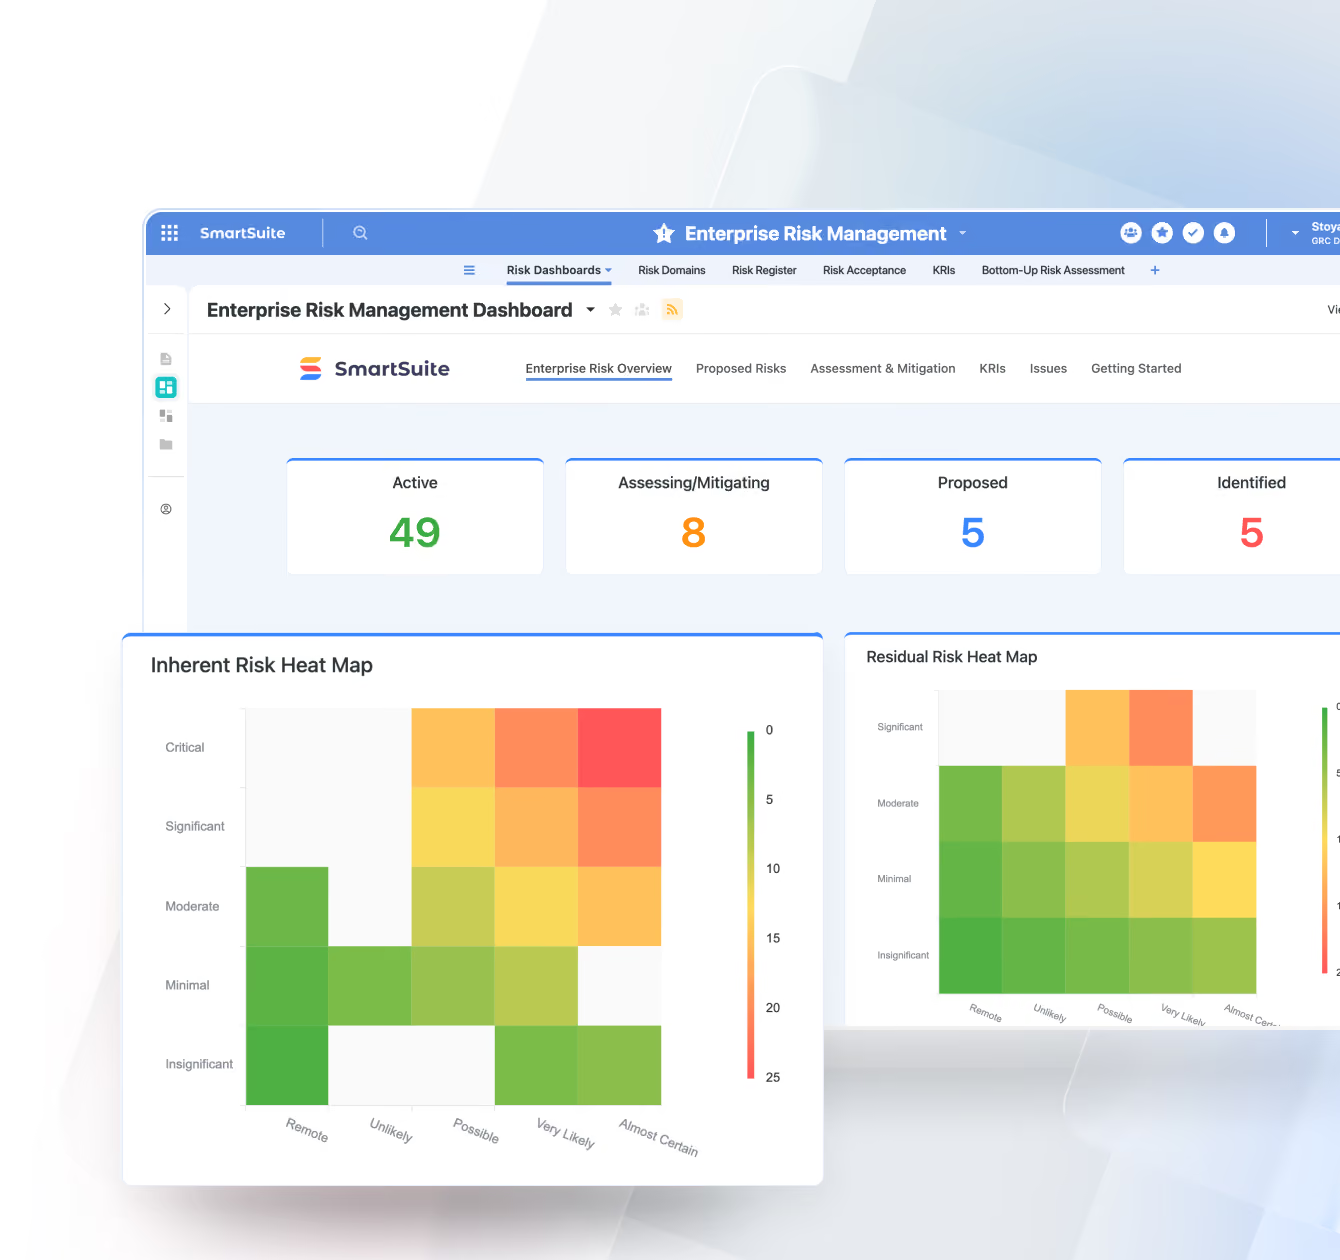
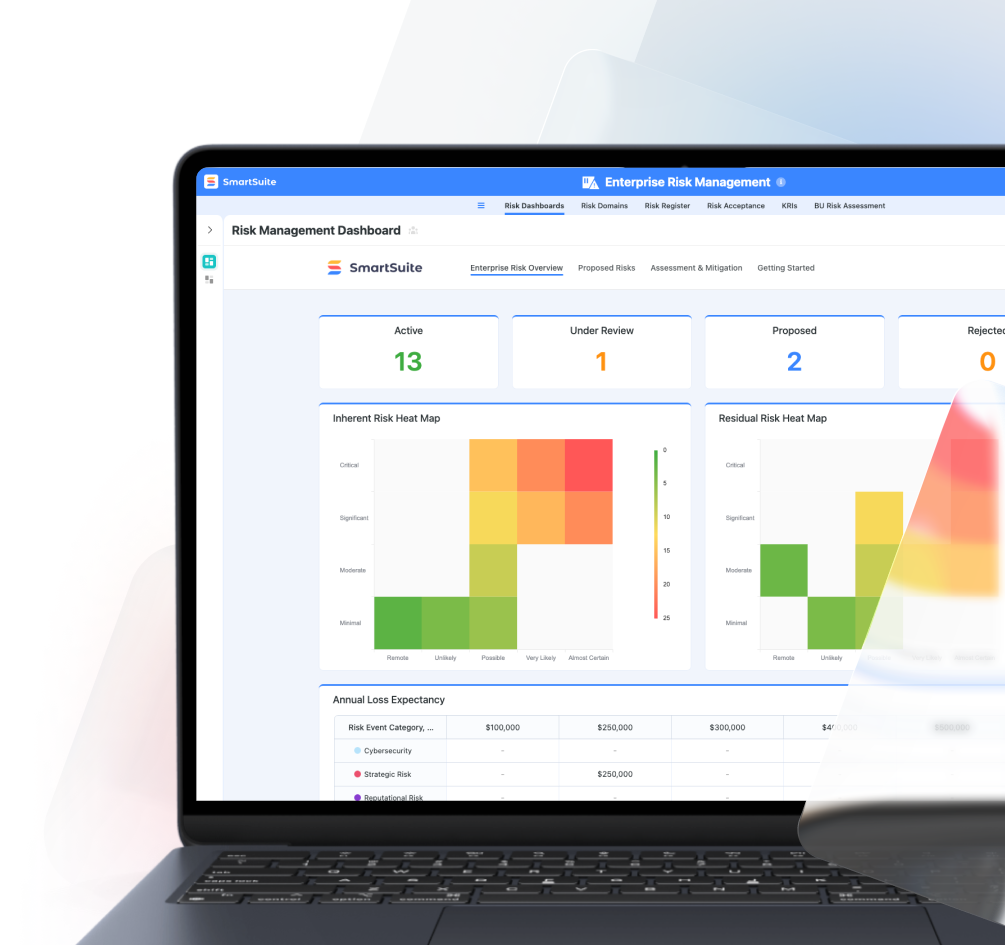
Dashboard View
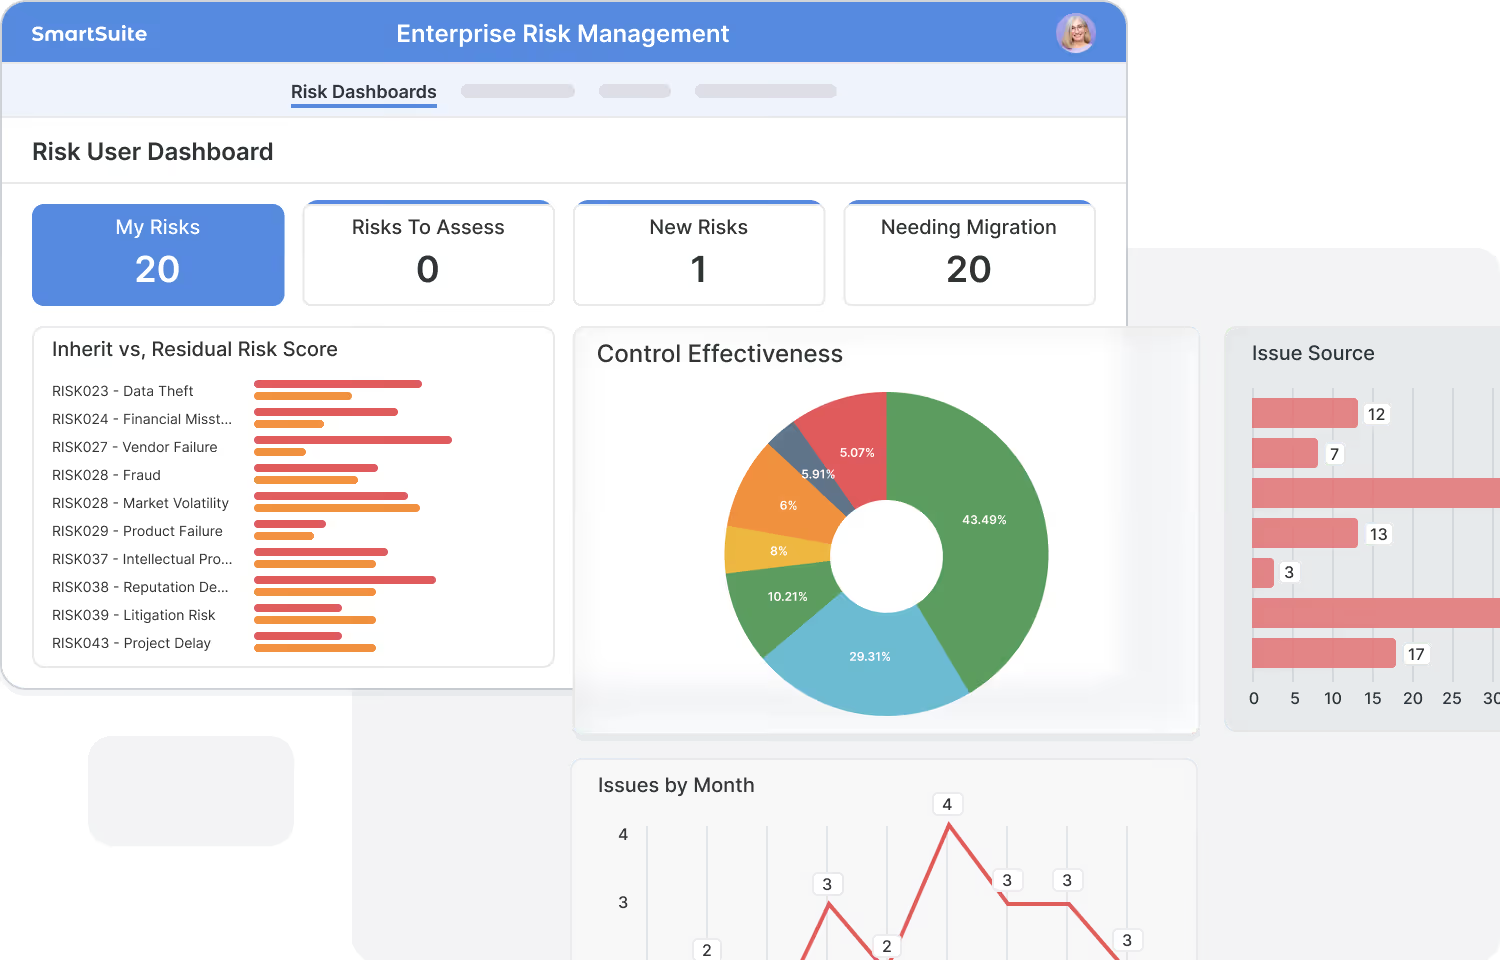
See the big picture at a glance. Dashboards combine charts, metrics, and widgets into a single, interactive view, so teams always understand performance and trends in real time.
- Enterprise Risk Dashboard
- Third-Party Risk Dashboard
- Regulatory Change Dashboard
- Crisis Management Dashboard
Grid View
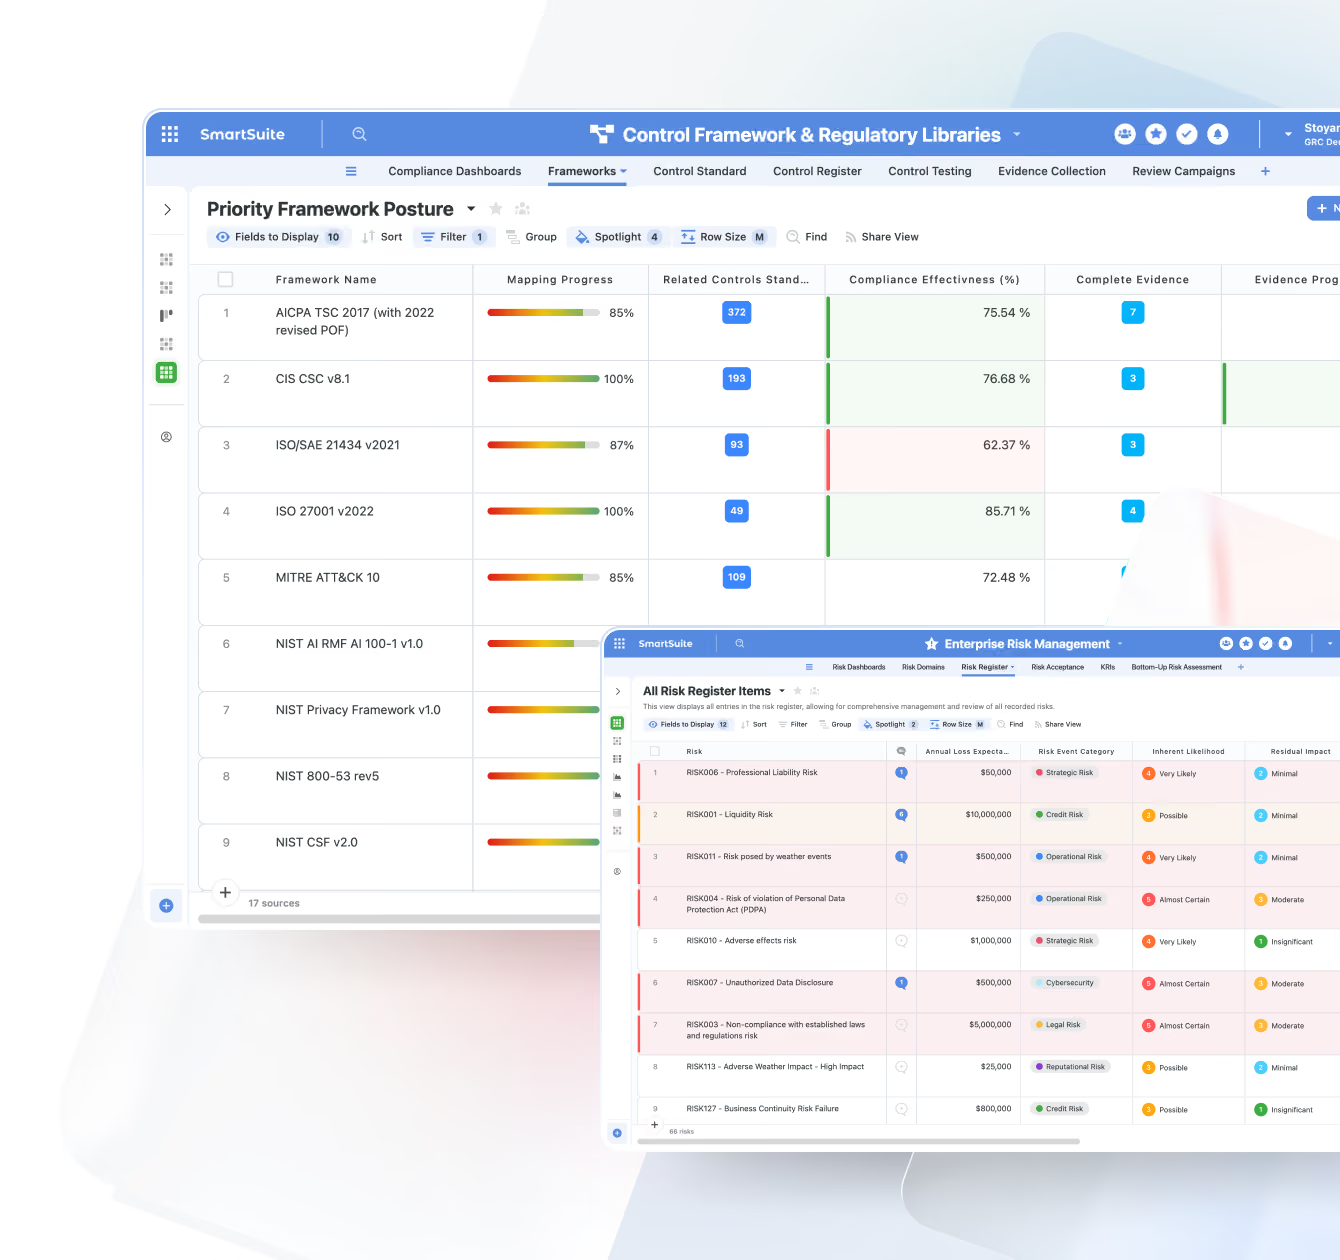
Your most flexible, spreadsheet-style view for managing structured data. Perfect for analysis, inline editing, and bulk updates across any workflow.
- Issue & Control Inventory
- Project Task List
- Customer or Vendor Master File
- Audit Evidence Tracker
Card View
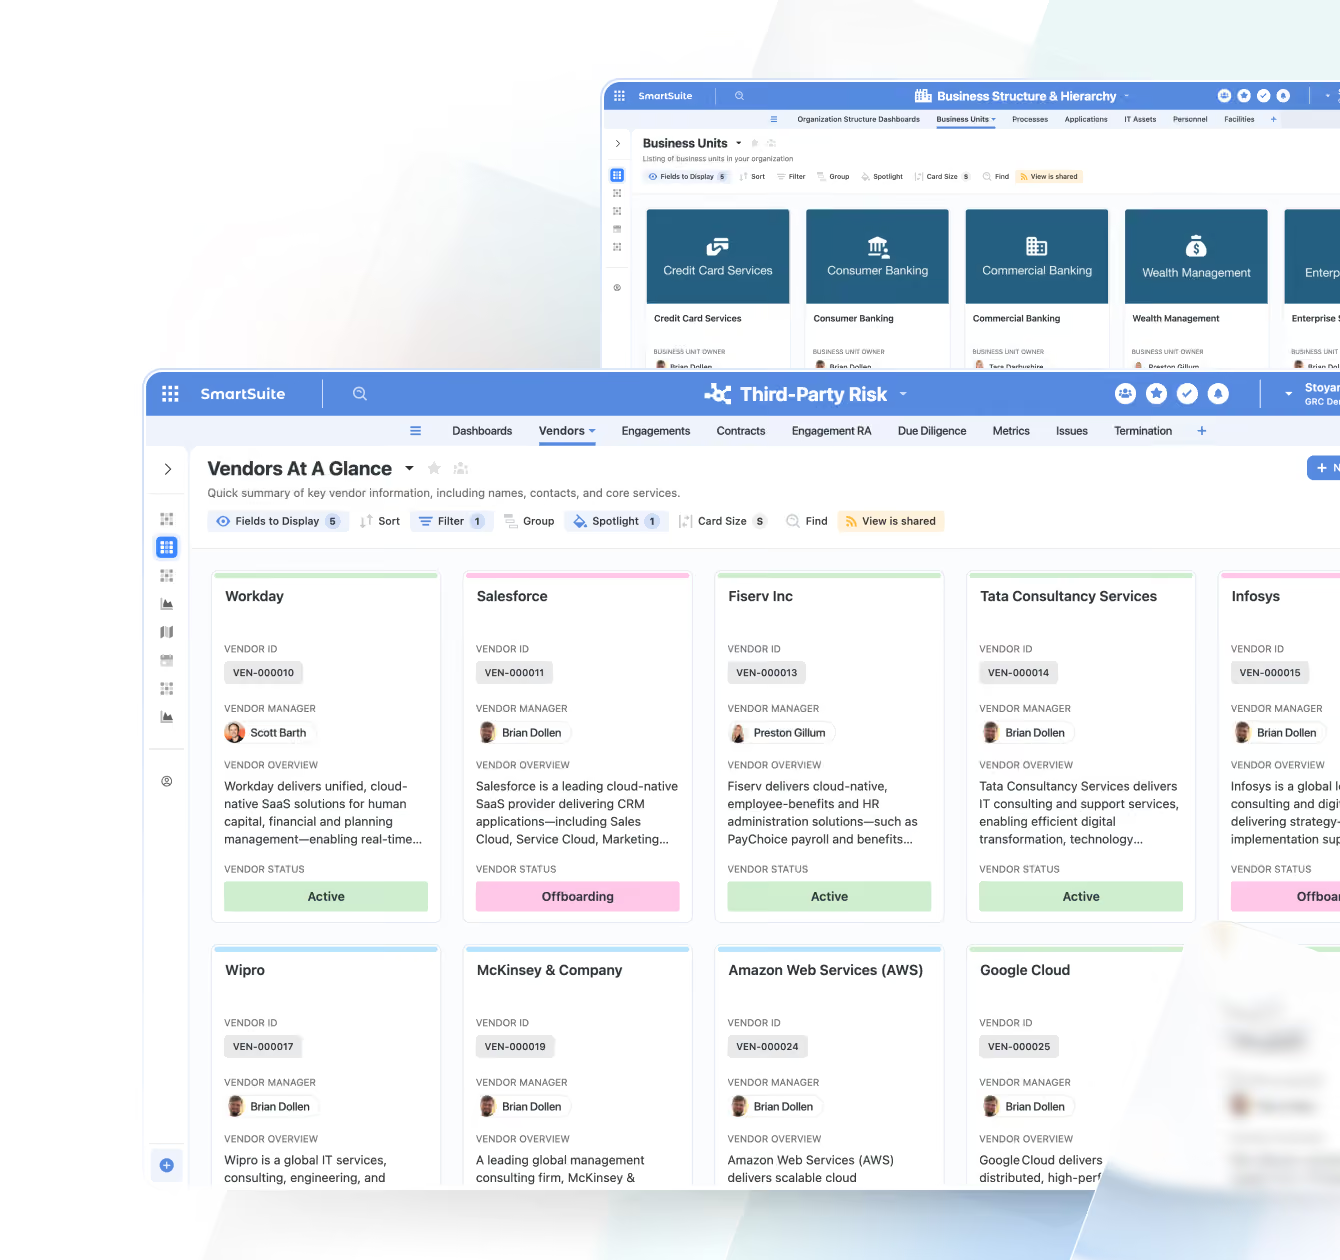
Visualize records as cards instead of rows, ideal for scanning key information quickly or organizing items by category, owner, or status.
- Customer Profiles
- Employee Directory
- Asset Inventory Cards
- Feature or Idea Backlog
Kanban View
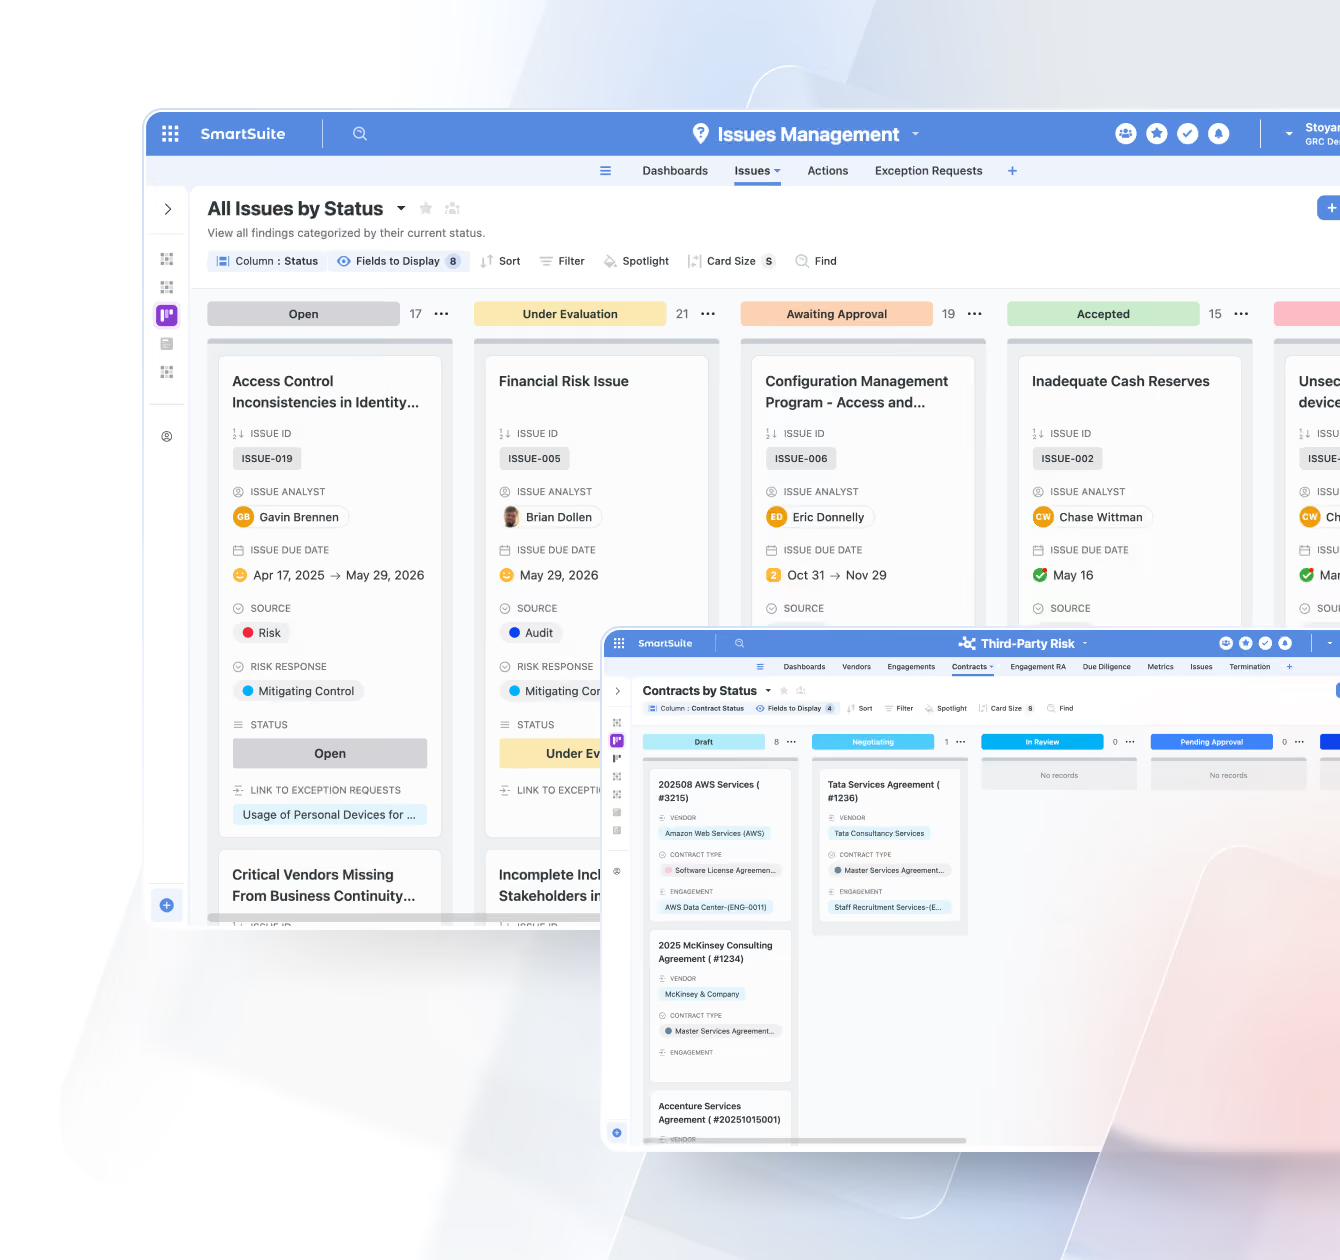
Track work as it moves through stages with a drag-and-drop board. Ideal for workflows with clear statuses or approval paths.
- Risk Treatment Workflow
- Sales Opportunity Stages
- Content Publishing Pipeline
- IT Ticket Progress
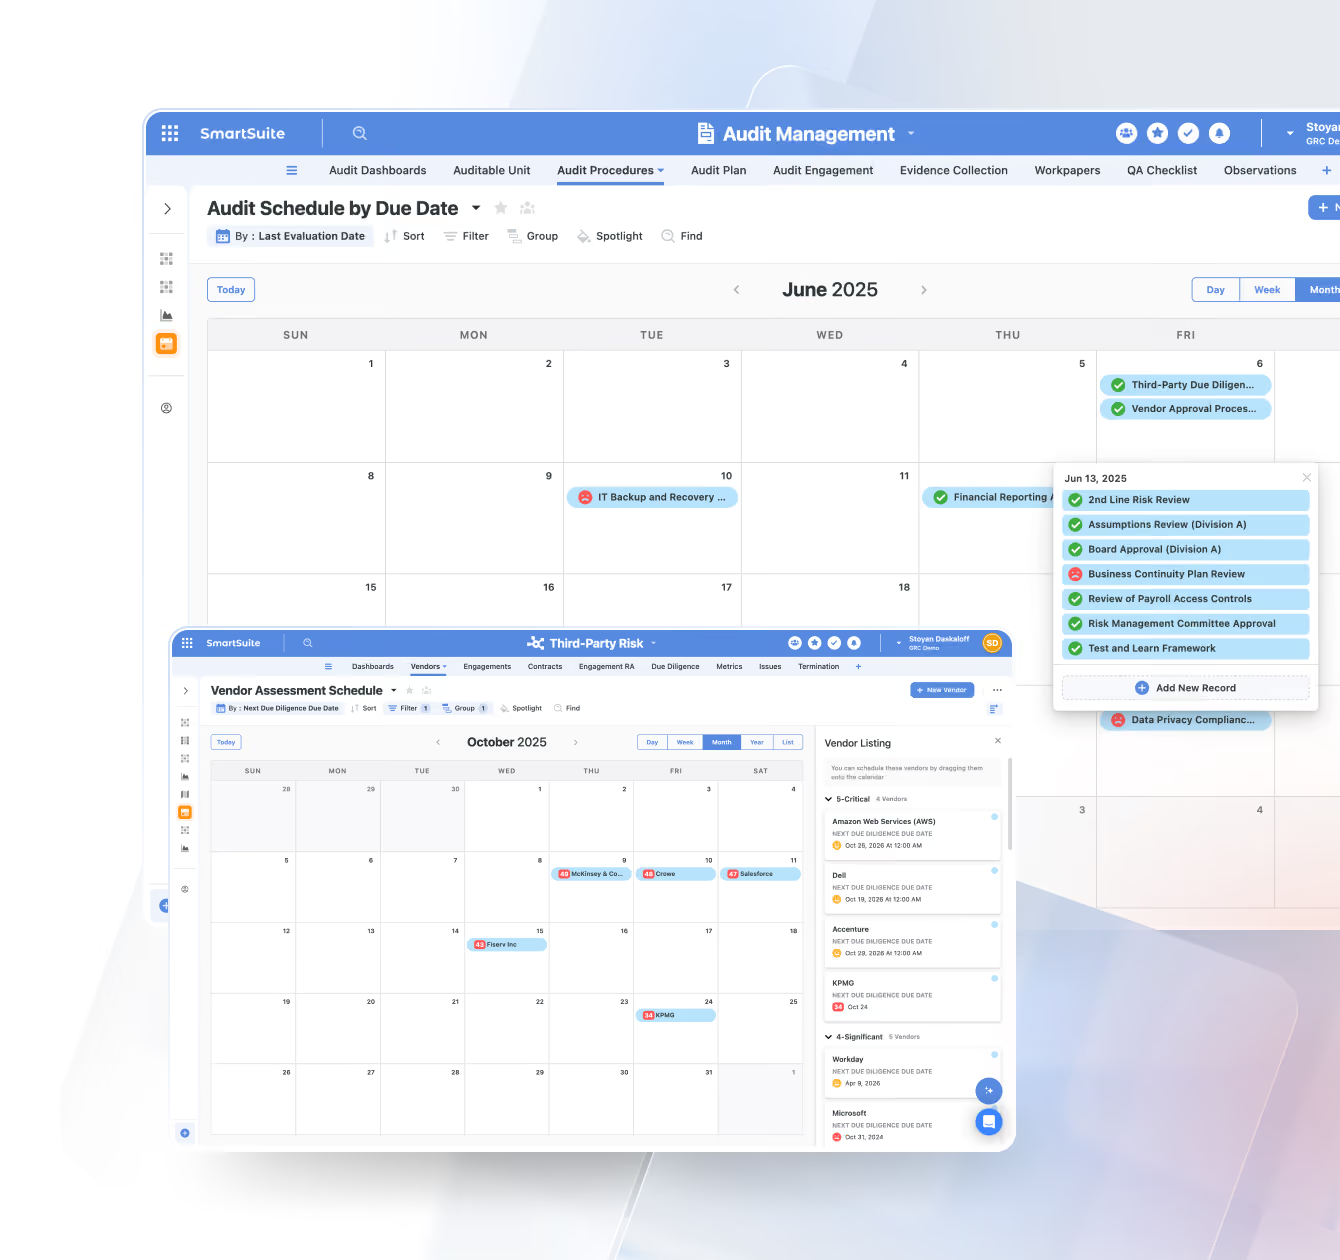
Calendar View
Plot records across days, weeks, or months to visualize schedules, timelines, or time-dependent activities.
- Compliance Deadlines
- Marketing Campaign Calendar
- Employee Time-Off Schedule
- Project Milestones
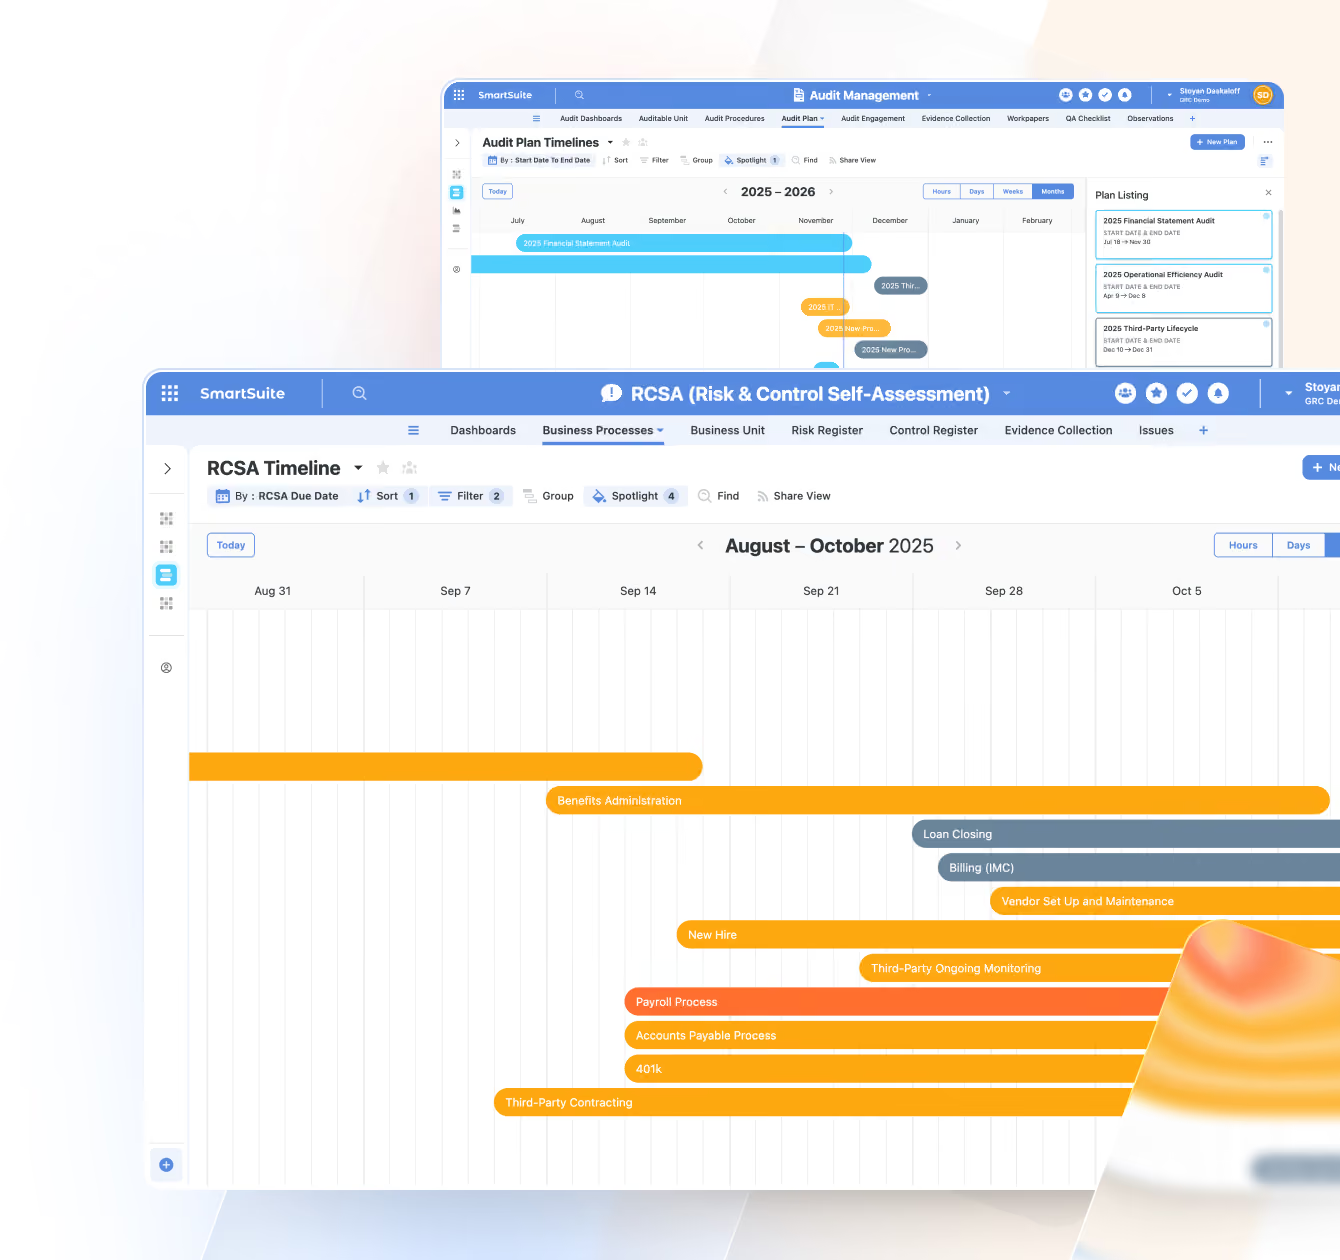
Timeline View
Understand duration-based work with a timeline that shows tasks and schedules over time, perfect for project and resource planning.
- Implementation Roadmap
- Risk Assessment Activities
- Hiring Pipeline Stages
- Grant or Contract Timelines
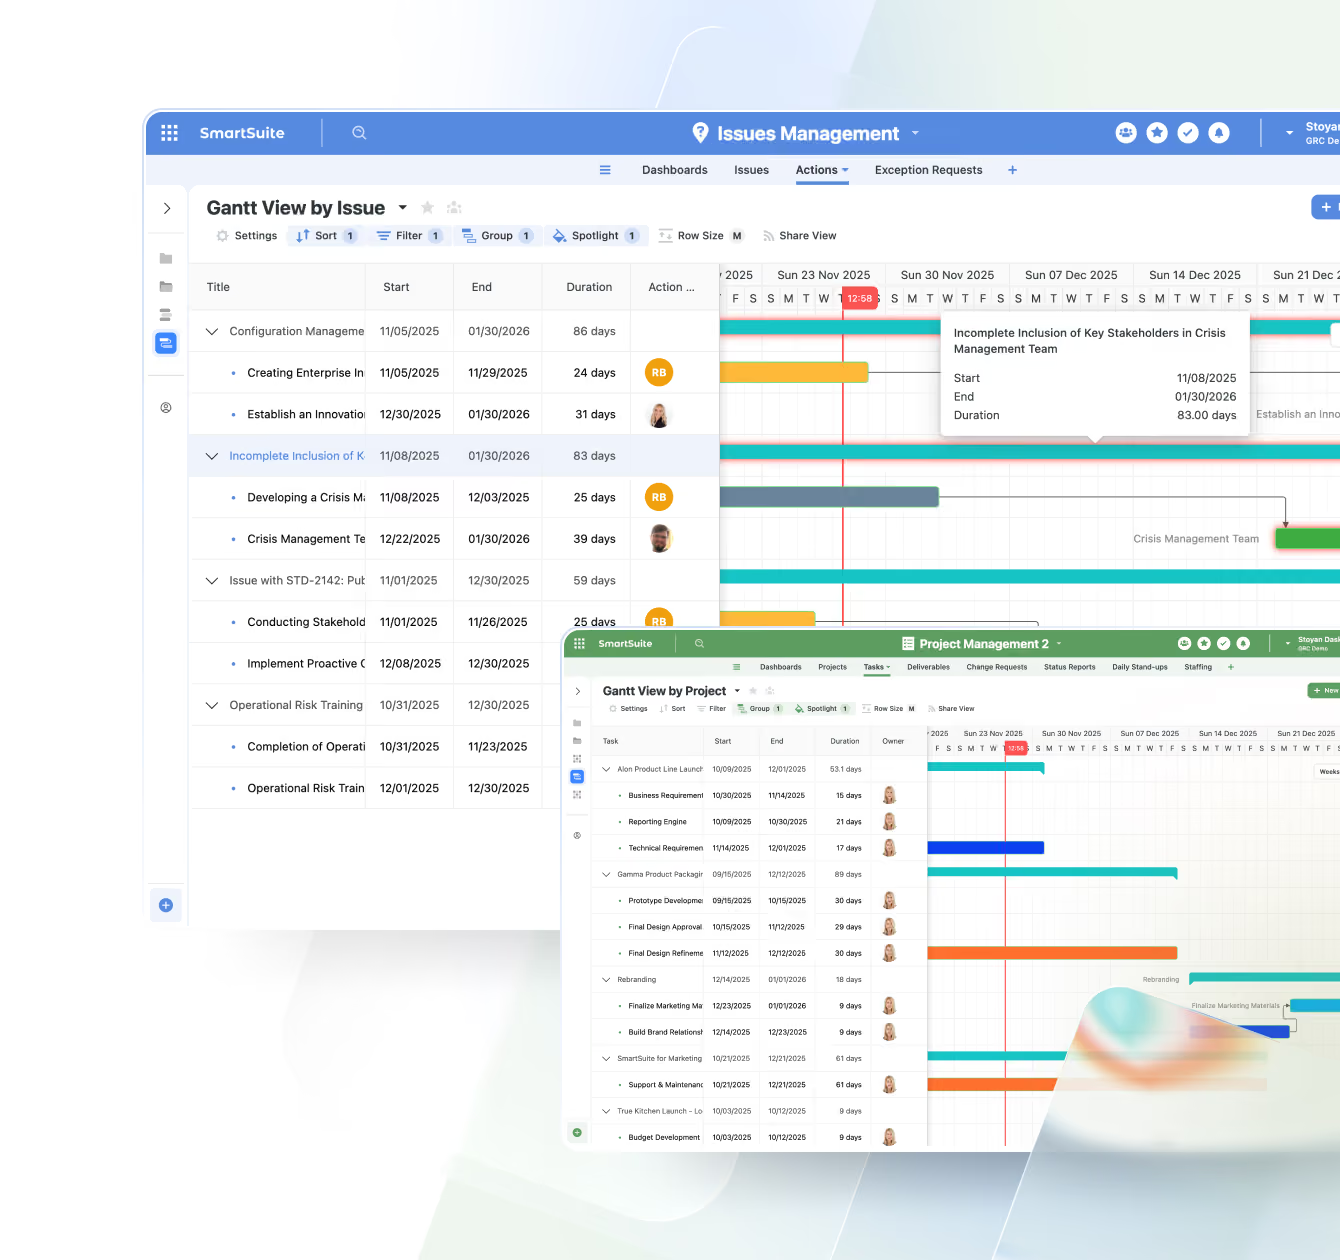
Gantt View
A project management essential. Visualize timelines, dependencies, and critical paths to keep teams aligned and projects on track.
- Software Release Plan
- Business Continuity Plan Testing Schedule
- Construction Project Phases
- Event Planning Schedule
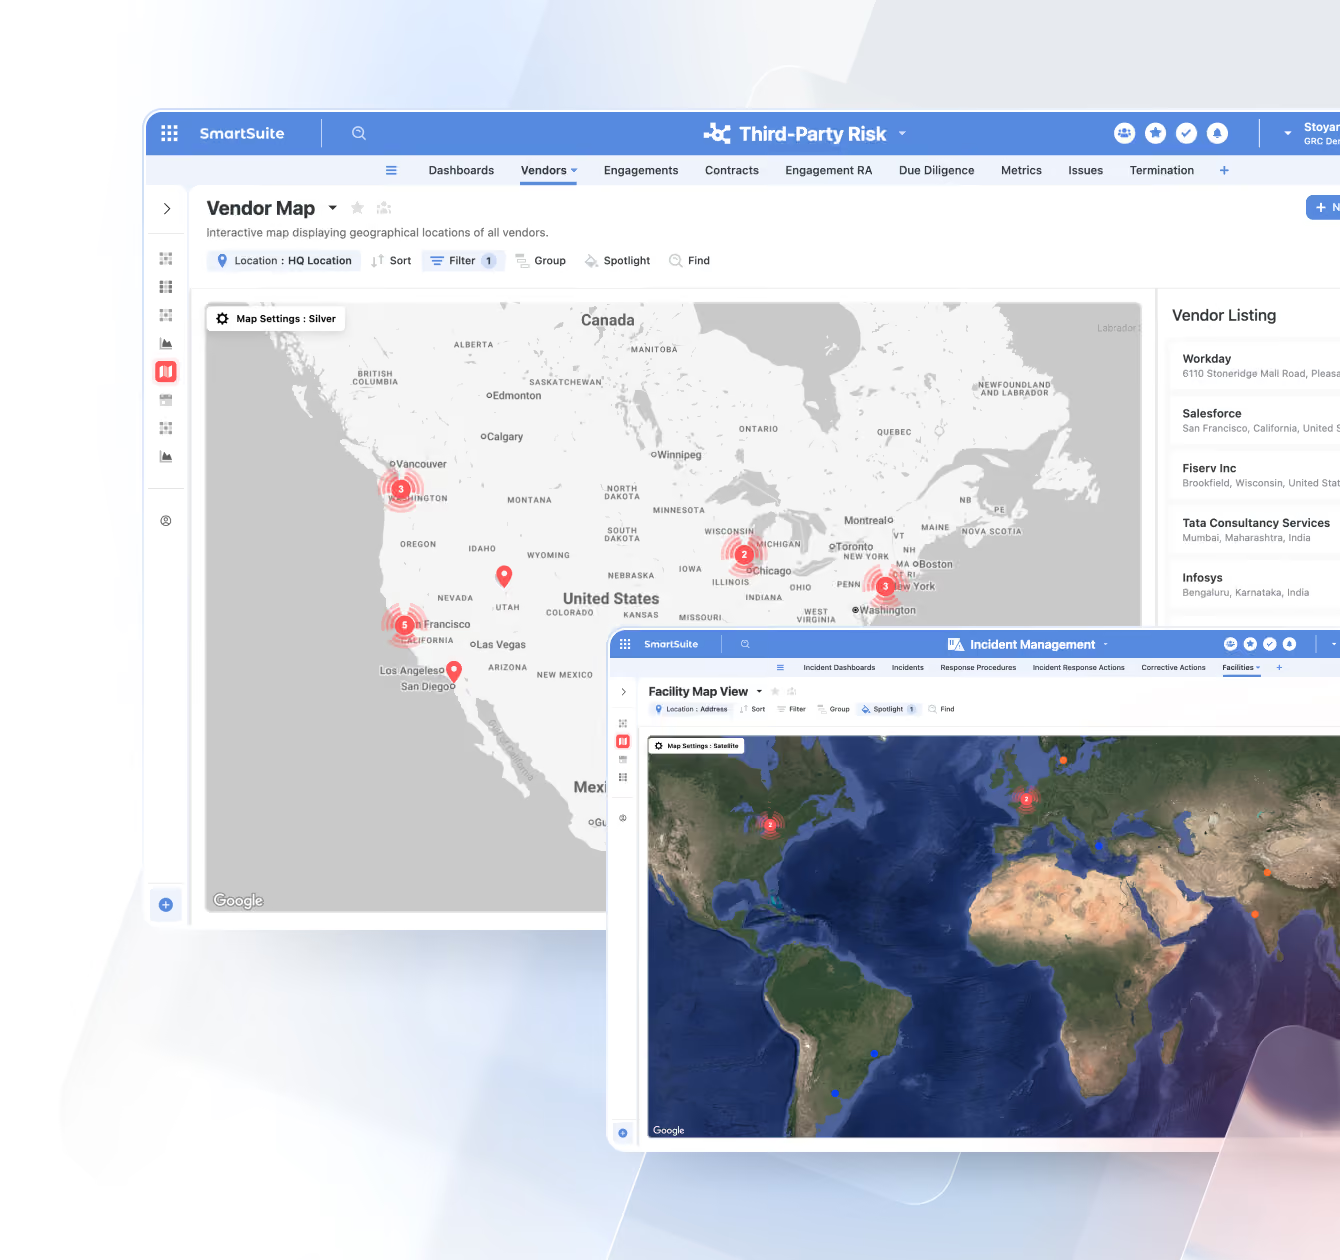
Map View
Plot any record with a location field on an interactive map, ideal for geographically distributed assets, customers, or operations.
- Store or Facility Locations
- Field Service Routes
- Incident or Outage Locations
- Customer Geo Distribution
Forms View
Collect structured data through branded, user-friendly forms that feed directly into your workflows, no integrations required.
- Intake for Support Tickets
- New Vendor / Third-Party Requests
- Project or Work Intake Forms
- Customer Feedback & Surveys
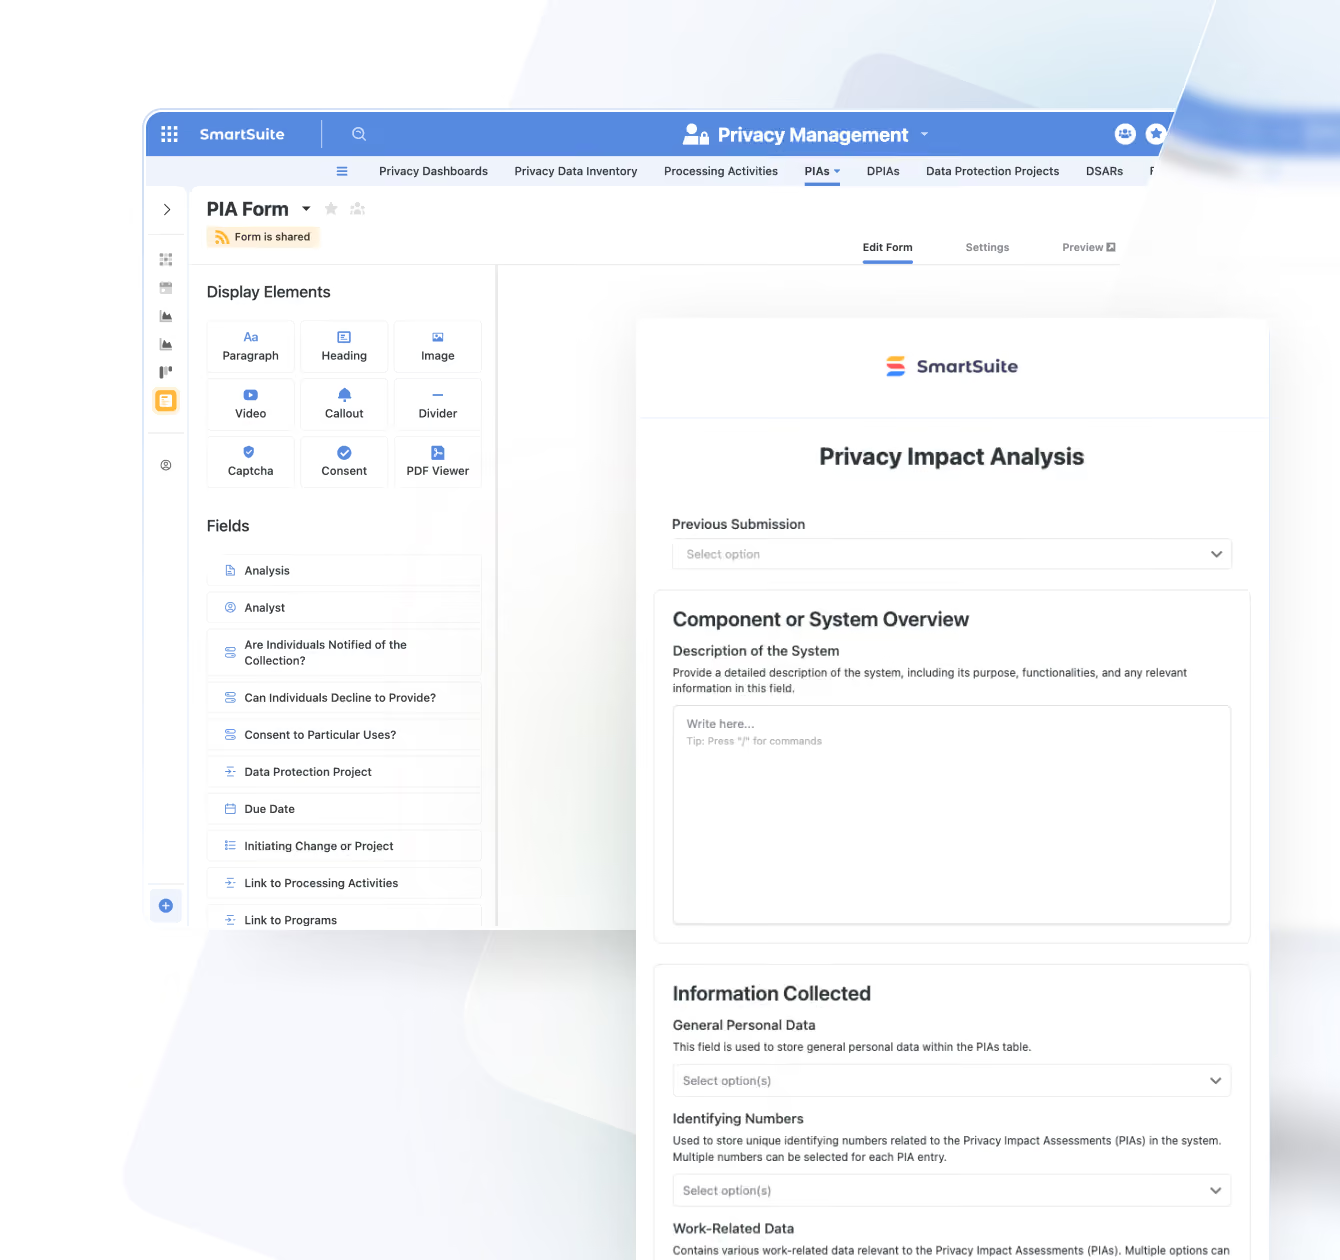
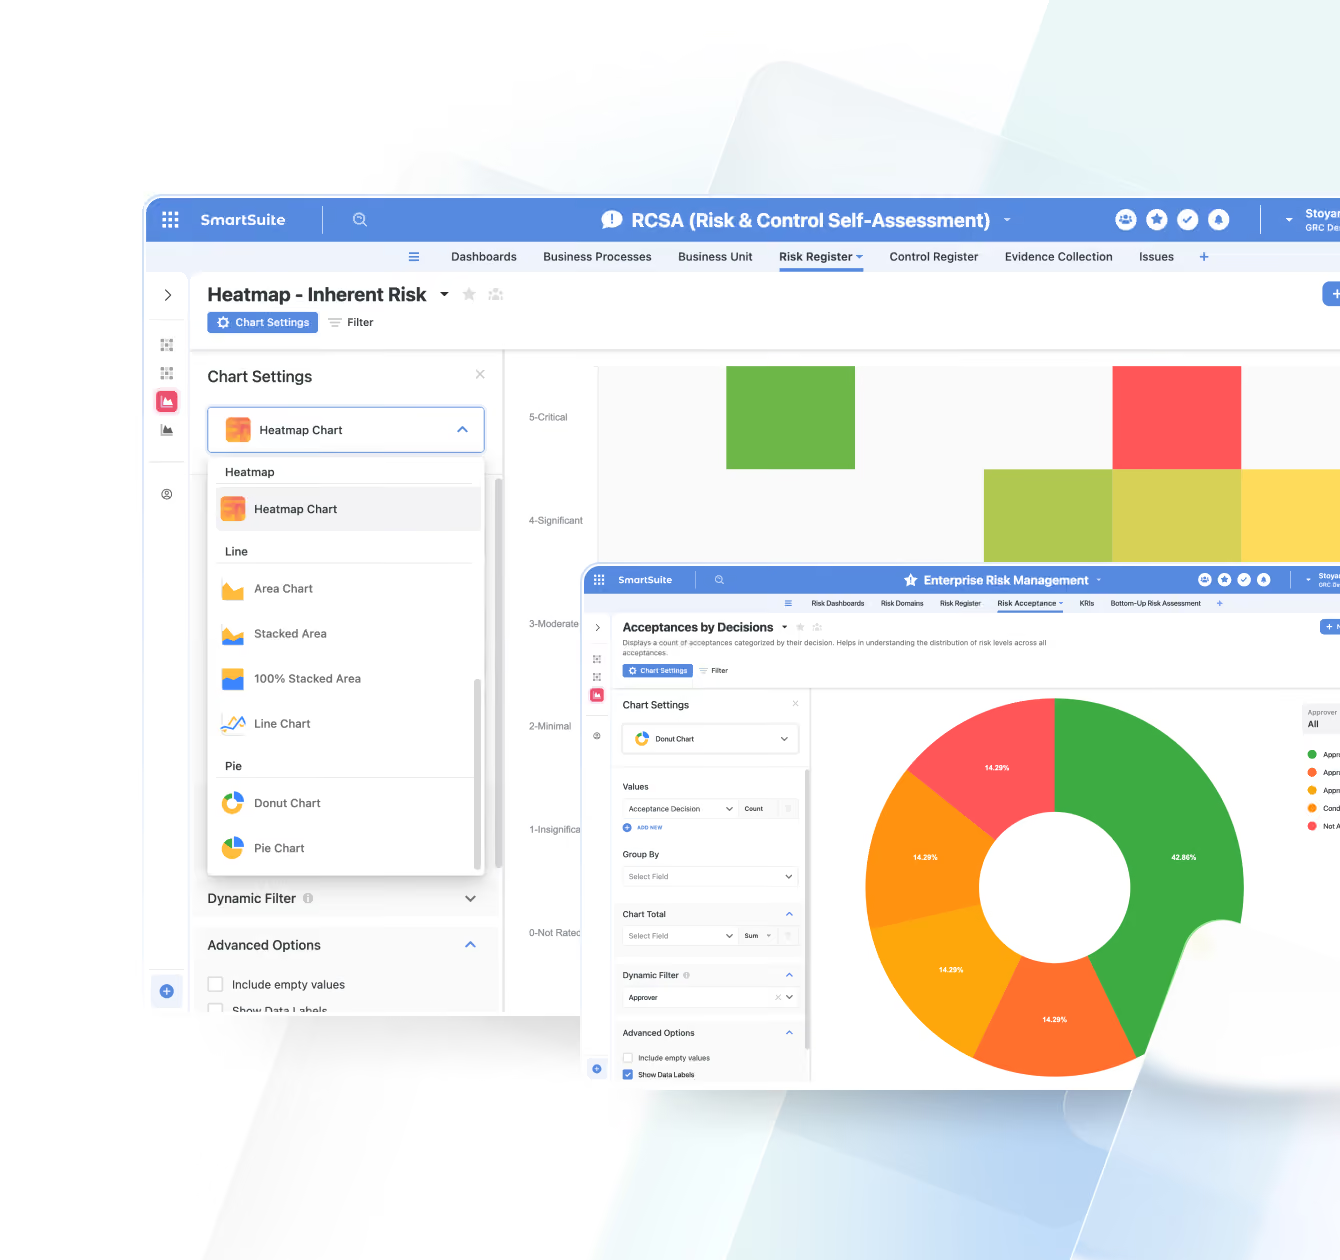
Chart View
Turn your data into insights with bar, line, pie, donut, bubble, and other chart types. Ideal for quick reporting and KPI tracking.
- Control Effectiveness Trends
- Sales by Region
- Time-to-Close KPIs
- Budget vs Actuals
Document View
Write, edit, and collaborate on rich documents right next to your workflow data. Perfect for narrative reporting and documentation.
- Audit or Assessment Reports
- Project Briefs
- Policies & Procedures
- Meeting Notes & Summaries
Built For Every Level Of Your Organization
SmartSuite reporting supports leaders, managers, and individual contributors with the right level of visibility for their work.

For Leaders. Portfolio dashboards across risk, projects, incidents, and key initiatives to understand overall posture and performance.

For Managers. Live views of SLAs, throughput, and workload that make it easy to spot bottlenecks and rebalance work.

For Individual Contributors. My work today/this week views that keep priorities clear and reduce the need for status meetings.

For Board Members. High-level dashboards that consolidate organizational performance, risk posture, and strategic initiatives, giving boards the clarity needed for confident oversight.
Key Capabilities.
Unified Dashboards For Every Team
Dashboards give every team a shared, trusted view of performance, from executive oversight to frontline operations. Whether you're tracking risk posture, project timelines, or departmental throughput, dashboards provide a consolidated picture of what’s happening right now. For example, a GRC dashboard might combine open issues, upcoming assessments, and vendor risk ratings into a single review board for the risk committee.
- Build executive-level overviews that surface trends across projects, risks, incidents, or customers.
- Give managers visibility into bottlenecks, SLA performance, and team workloads.
- Standardize recurring reviews, weekly syncs, monthly check-ins, QBRs, with dashboards that never go stale.
- Pull in any View, chart, or metric to build contextual, workflow-specific reporting.


Stay Aligned With The Rhythms Of Your Business
SmartSuite keeps reporting in sync with how work actually moves. As records progress, escalate, or close, dashboards and views update instantly, giving teams clarity during every daily stand-up, weekly planning session, or high-stakes escalation.
- Use live boards during stand-ups to review what changed in the last 24 hours.
- Eliminate slide decks for leadership updates, dashboards are the deck.
- Track SLA breaches, overdue work, and workflow exceptions as they happen.
- Make decisions based on current data, not exports created hours or days earlier.
The Working Surface For Every Team’s Day-To-Day
Views are where teams actually live. They provide the personalized, filtered, and organized perspective each user needs to get work done, while staying directly tied to real-time data and automations. Export views when you need a static snapshot, but keep stakeholders in live dashboards and views as the source of truth.
- Create personal or team-based Views like My Open Items, Upcoming Reviews, or Critical Risks.
- Use filtering, grouping, and sorting to narrow large datasets into actionable slices.
- Work in the format that fits the task: Grid, Kanban, Timeline, Calendar, Chart, Map, or Card.
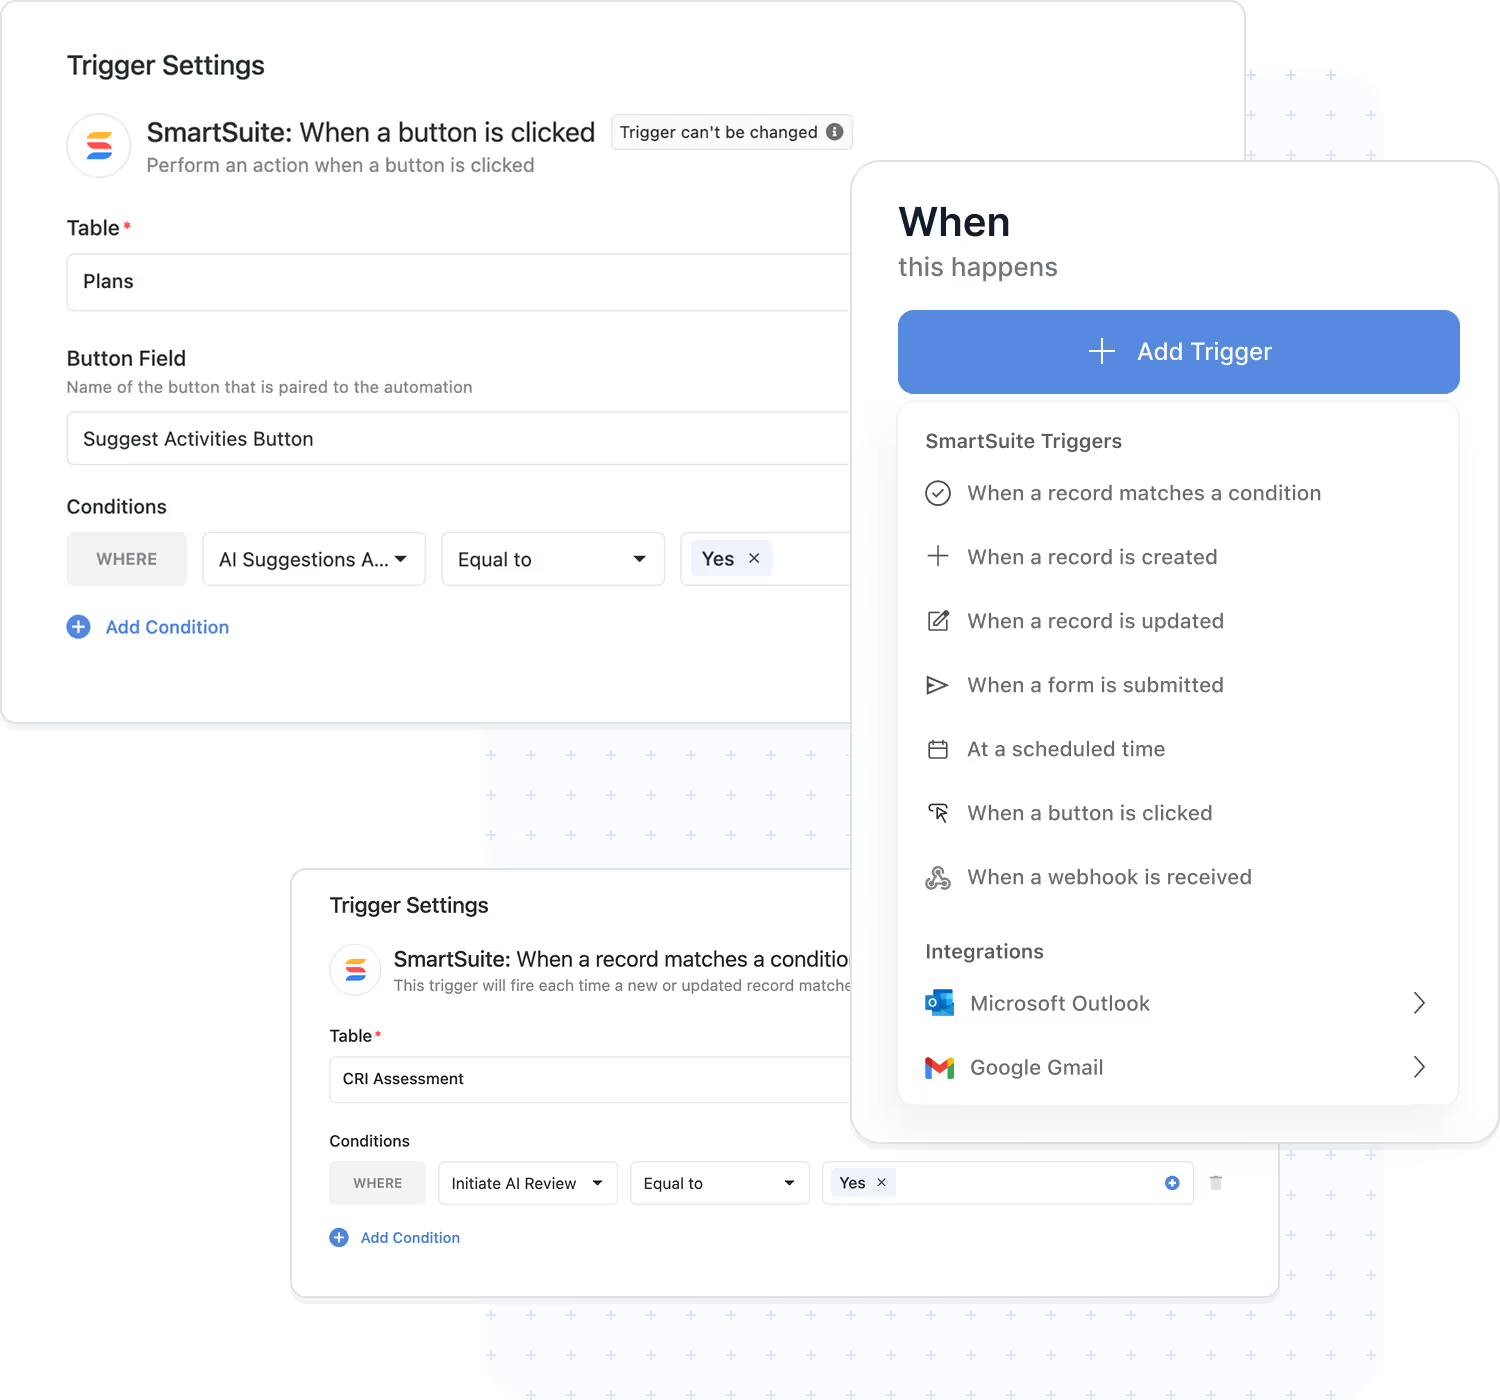
- Trigger automations from status changes, assignments, or date-driven groupings inside any View.


Security And Governance Built Into Every Chart
SmartSuite ensures that dashboards and views honor the same record-level and field-level permissions that govern your workflow. Sensitive data stays protected, even when teams share dashboards across departments or with external collaborators.
- Field and record level permissions flow through to every metric, chart, and widget automatically.
- Prevent unauthorized access without managing separate reporting permissions.
- Share dashboards confidently with internal executives or external stakeholders.
- Maintain compliance by controlling what users see, and what they never see.
Reporting That Scales With Your Workflows
As your organization adds new processes, builds new solutions, or expands across teams, reporting grows with you. The SmartSuite analytics layer unifies data across workflows so insights stay consistent, no rebuilding or duplicating reports.
- Roll up data from multiple Solutions into unified cross-workflow dashboards.
- Reuse metrics, charts, and saved configurations as your workspace expands.
- Ensure consistent reporting across departments, even as processes evolve.
- Build a long-term analytics foundation that supports broader automation, AI, and governance.

Reporting Driven by SmartSuite’s Connected Architecture
Dashboards and views don’t live in isolation. They sit on top of your data model, automations, and permission framework, so every insight reflects how your business actually operates.
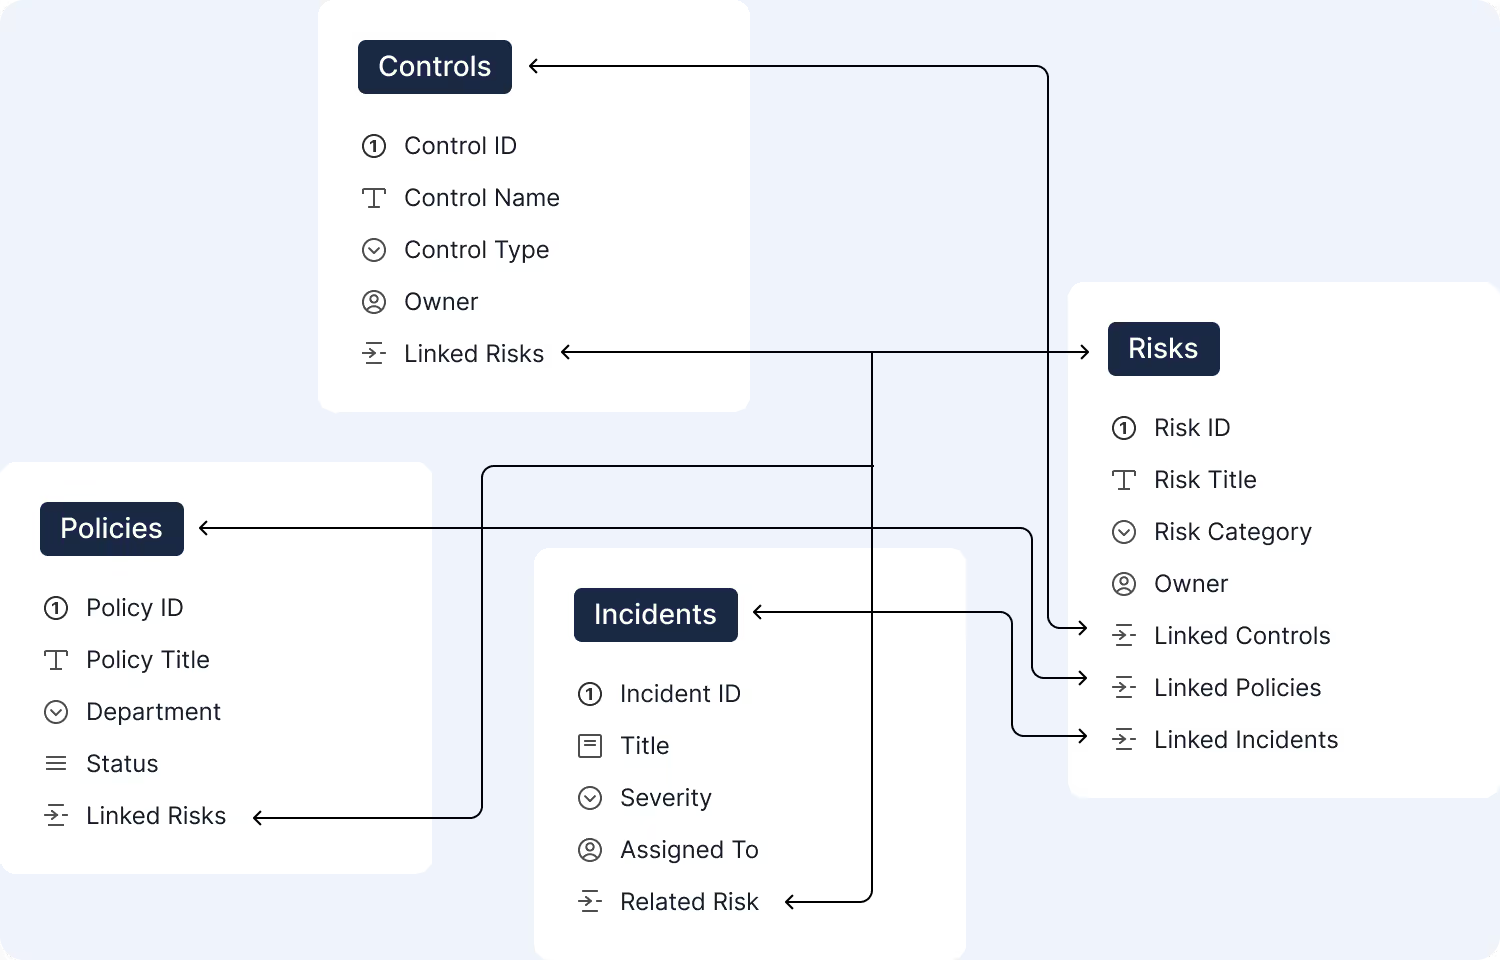
Reporting pulls directly from structured Solutions and relationships you define.
Metrics and charts reflect the latest state driven by workflows, SLAs, and AI-powered updates.
Record and field-level controls flow straight through to what people see in dashboards and views.
Reporting elements can be embedded into tailored interfaces for specific teams and use cases.
Frequently Asked Questions About Visualizing Data in SmartSuite
SmartSuite dashboards pull directly from your live workflows—projects, risks, incidents, tickets, assets, controls, requests, or any table—so every metric, chart, and visualization reflects the most current operational reality. There’s no exporting, syncing, or manual refresh required.
Yes. Dashboards are cross-solution by design. You can pull metrics, charts, lists, calendars, or KPIs from any table across your workspace, making them ideal for executive rollups, PMO oversight, GRC reports, ITSM health, or multi-department programs.
Permissions flow directly from your underlying data model. Users only see the records and fields they have access to, even when viewing shared widgets or dashboards. This preserves confidentiality while still enabling broad visibility.
SmartSuite includes charts, graphs, gauges, KPIs, calendars, kanban boards, lists, record galleries, hero sections, banners, text blocks, filters, buttons, and embedded external content. This enables both analytical dashboards and page-like, narrative experiences.
Absolutely. Dashboards can be fully tailored by team, role, or department. You can create executive views, operational command centers, department-specific portals, customer-facing dashboards, and everything in between.
Yes. Users can filter, drill into records, expand views, pivot data, adjust date ranges, and explore linked information in context. Interactions always reflect the user’s permissions and the live state of your data.
Yes. Dashboards can be shared in a controlled, view-only mode with external stakeholders such as clients, partners, and auditors. Access remains secure, does not reveal underlying Solutions, and respects all permission rules.
Dashboards update automatically whenever your data changes, making them ideal for tracking KPIs, SLAs, compliance status, project health, risk exposure, capacity planning, and operational throughput. They act as a real-time system of record for your entire business.

Written by
SmartSuite Staff
· Reviewed
October 17, 2026
Explore the platform
The ten capabilities of the SmartSuite platform, each on its own page.