



Risk register and risk assessment matrix: how to build one (with template)
How to build a risk register and a 5×5 risk matrix that survive audit, using ISO 31000, NIST and COSO scales.
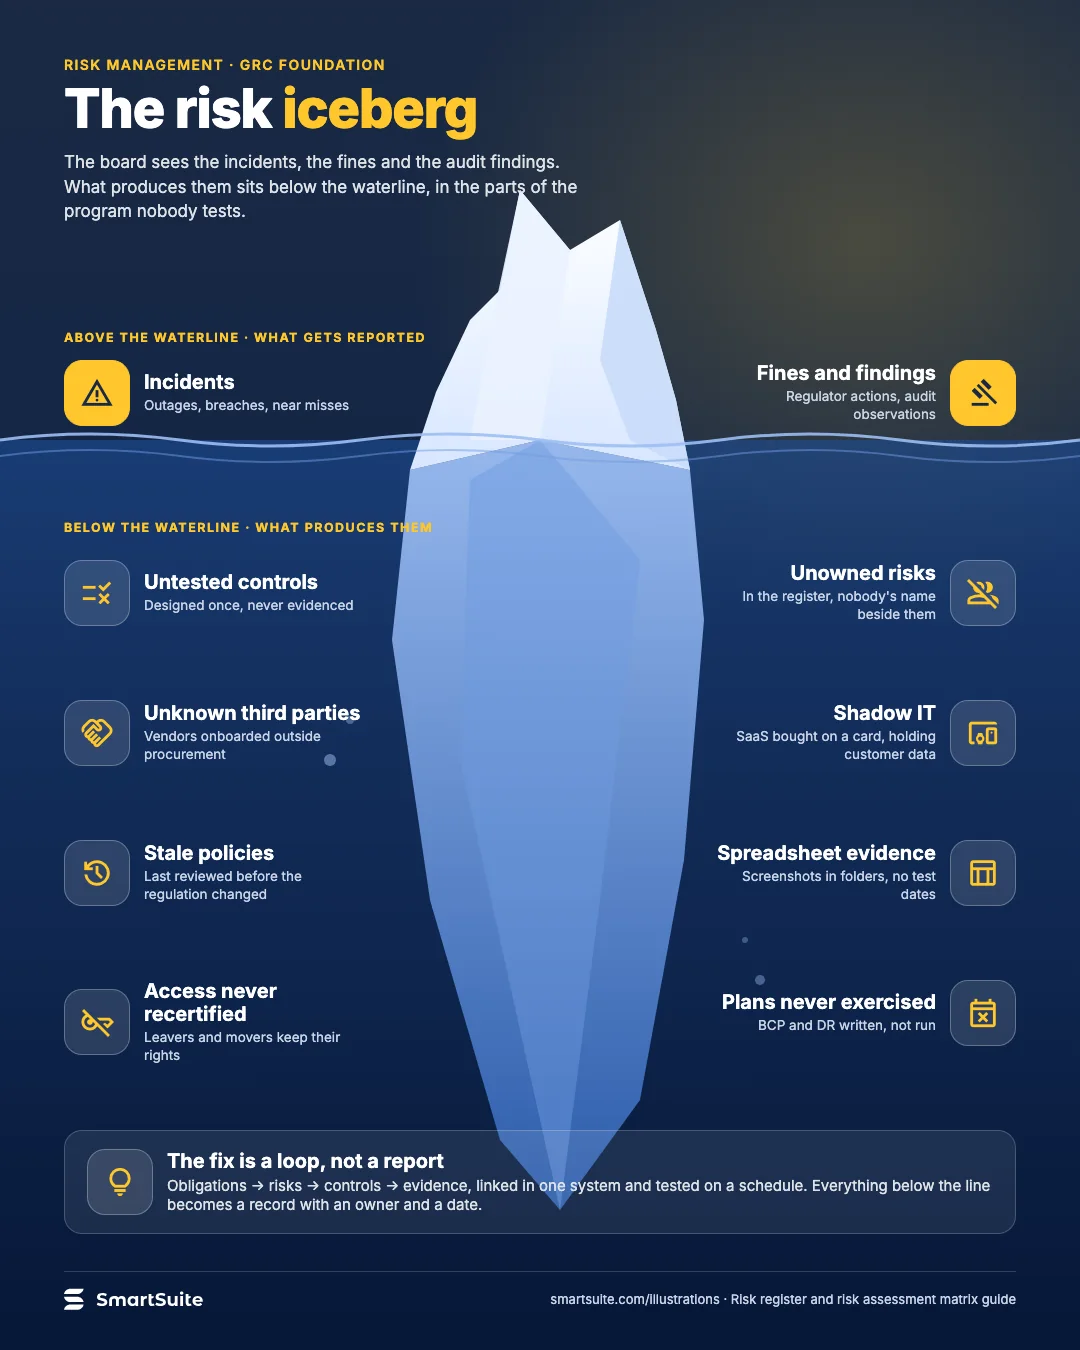
Answer first. A risk register is the controlled list of identified risks, each with an owner, a scored likelihood and impact, the controls that reduce it and a treatment decision. A risk assessment matrix is the grid, usually 5×5, that turns those ratings into a level of risk. The register is the record; the matrix is one way to rate it.
What a risk register is, and what it is not
ISO 31000:2018 defines risk as the "effect of uncertainty on objectives" (clause 3.1) and notes that the effect can be positive, negative or both. It describes risk management as the coordinated activities an organization uses to direct and control itself with regard to risk (3.2), and asks for the process and its outcomes to be recorded and reported (6.7). The register is where that record lives.
NIST IR 8286 gives the most concrete public description of the artifact. It quotes the US Office of Management and Budget's Circular A-11: a risk register typically holds a description of each risk, its impact if it occurs, its probability, mitigation strategies, risk owners, and a ranking that identifies higher-priority risks. NIST adds a notional template with eleven elements (next section) and points out that the register captures a single point in time, so it must be maintained as a cycle rather than filled in once.
Three things a risk register is not:
- It is not the assessment. The assessment is the work of identifying, analyzing and evaluating risk (ISO 31000:2018 clause 6.4). The register stores the result. If nobody can say when each row was last assessed and by whom, you have a list, not a register.
- It is not a complete inventory of everything that could go wrong. NIST IR 8286 draws on OMB Circular A-123 to distinguish a risk profile, a prioritized inventory of the most significant risks, from a complete inventory. The register feeds the profile.
- It is not the control library or the issue log. Controls, issues and actions belong in their own records and link to the register; see How Controls Connect Risk, Compliance, Audit, and Remediation.
The register also differs from an RCSA. A risk and control self-assessment is a campaign run by first-line owners against a defined scope; the register is the enterprise record the campaign feeds. RCSA vs Risk Assessment vs Control Testing sets out the boundaries.
What goes in the register, field by field
The table combines the eleven elements in NIST IR 8286 Table 2 with the fields that ISO 31000:2018 and COSO ERM 2017 imply but do not prescribe: inherent and residual views, appetite, and links to controls and indicators. The right-hand column says where each field comes from so you can defend it to an auditor.
| Field | What it holds | Source |
|---|---|---|
| Risk ID | A stable identifier that never changes | NIST IR 8286 Table 2 |
| Title | A short name for lists and dashboards | Practical |
| Risk statement | Cause, event and consequence in one sentence (next section) | NIST IR 8286 recommends cause-and-effect wording |
| Category | The taxonomy node (strategic, operational, financial, compliance, technology, third party) | NIST IR 8286 Table 2; used to consolidate registers |
| Objective affected | The business objective the risk threatens | ISO 31000:2018 3.1; COSO ERM 2017 principle 10 |
| Business unit or process | Where the risk sits | Needed to aggregate and to route the assessment |
| Risk owner | The person accountable for the risk being managed | NIST IR 8286 Table 2; ISO Guide 73:2009 (3.5.1.5) defines a risk owner as the person or entity with the accountability and authority to manage a risk |
| Date identified and source | When, and from what (RCSA, audit finding, incident, BIA, scenario workshop) | ISO 31000:2018 6.4.2 and 6.7 |
| Inherent likelihood and impact | Ratings before any risk response, on the organization's scale | NIST IR 8286 calls this the current or initial assessment |
| Inherent score and rating | The matrix output (for example 4 × 4 = 16, Critical) | NIST IR 8286 "Exposure Rating"; ISO 31000 and NIST SP 800-30 Rev. 1 call it level of risk |
| Existing controls | Links to control records, not free text | ISO 31000:2018 6.4.3 lists the effectiveness of existing controls as an analysis factor |
| Control effectiveness | The most recent test or self-assessment result | Evidence for the drop from inherent to residual |
| Residual likelihood, impact, score, rating | Ratings after existing controls | NIST IR 8286 3.5.2 |
| Appetite threshold and "within appetite?" | The limit the risk is judged against | ISO 31000:2018 6.3.4 risk criteria; COSO ERM 2017 principle 7 |
| Treatment option | Accept, mitigate, transfer or avoid (realize, share, enhance, accept for opportunities) | NIST IR 8286 Tables 3 and 5; ISO 31000:2018 6.5.2 |
| Treatment plan and action links | Links to issue or action records with owners and due dates | NIST IR 8286 "Risk Response Description" and "Risk Response Cost" |
| Target residual score | Where the risk should be once actions complete | Lets you report progress against a number |
| KRIs | Linked indicators and their status against threshold | ISO 31000:2018 6.6 monitoring and review |
| Linked BIA process or critical service | The process whose impact tolerance the risk threatens | Connects to the Business Impact Analysis |
| Last assessed, next review, status | The cycle fields | NIST IR 8286 "Status"; NIST SP 800-30 Rev. 1 Step 4 |
| Approver | Who signed off an accepted risk, and when | Risk Acceptance in GRC |
Two design rules. Keep every link field as a real relationship to another record, not a pasted ID, or nothing rolls up. And fix the scales before you fill a row: the scale is part of the risk criteria ISO 31000:2018 (6.3.4) asks you to define before assessment begins, and changing it later means re-scoring everything.
How to write a risk statement
Most registers fail at the description field. "Cyber attack", "key person dependency" and "regulatory change" are categories, not risks; they cannot be scored because the reader cannot tell what would happen or to what.
NIST IR 8286 suggests writing risk descriptions in a cause-and-effect form. A practical pattern with three parts:
Because of [cause or risk source], [event] may occur, leading to [consequence for an objective].
For example: "Because payroll depends on a single SaaS provider with no tested fallback, an outage of more than five business days may occur, leading to missed salary payments and breach of employment contracts."
This maps onto ISO 31000:2018 clause 3, which characterizes risk by risk sources (3.4), events (3.5), consequences (3.6) and likelihood (3.7). It gives the assessor two things to rate separately, since likelihood belongs to the event and impact to the consequence. It also makes controls easy to map (they act on the cause, the event or the consequence) and KRIs easy to place (they watch the cause).
Likelihood and impact scales and the 5×5 matrix
A risk assessment matrix rates likelihood on one axis and impact on the other and reads the level of risk from the cell where they meet. NIST SP 800-30 Rev. 1 (September 2012) publishes the clearest public scales, and they are the ones to borrow if your organization has none.
Likelihood. NIST uses five qualitative values, each with a band on a 0 to 100 scale and a single value on a 0 to 10 scale (Tables G-2 and G-3):
| Qualitative value | 0 to 100 band | 0 to 10 value | Non-adversarial description (Table G-3) |
|---|---|---|---|
| Very High | 96 to 100 | 10 | Almost certain to occur; or occurs more than 100 times a year |
| High | 80 to 95 | 8 | Highly likely; or occurs between 10 and 100 times a year |
| Moderate | 21 to 79 | 5 | Somewhat likely; or occurs between 1 and 10 times a year |
| Low | 5 to 20 | 2 | Unlikely; or occurs less than once a year but more than once every 10 years |
| Very Low | 0 to 4 | 0 | Highly unlikely; or occurs less than once every 10 years |
The frequency anchors are the useful part. A scale with words alone produces different answers from different assessors. NIST SP 800-30 Rev. 1 says as much in section 2.3.2: unless each value is clearly defined or illustrated with examples, different experts can produce significantly different results, and repeatability improves when assessors record why they chose a value and use tables to combine values.
Impact. NIST Table H-3 uses the same five values. In plain terms: Very High means multiple severe or catastrophic effects on operations, assets, individuals or other organizations; High means one severe or catastrophic effect, such as loss of a primary function, major financial loss or serious harm to people; Moderate means a serious effect, such as significantly reduced effectiveness of a primary function; Low means a limited effect; Very Low means a negligible effect. Replace "major" and "significant" with your own currency amounts, hours of downtime, customer numbers or regulatory outcomes before you use the scale. Those anchors are the risk criteria ISO 31000:2018 (6.3.4) asks you to write down.
The 5×5 matrix. With both axes on a 1 to 5 scale the common practice is to multiply, giving a score from 1 to 25. The bands below are an example; the standards do not set them, and the published guides that rank for "risk matrix" disagree with each other on where Moderate ends. Set the bands to match your appetite statement and record the decision.
| Likelihood ↓ / Impact → | 1 Very Low | 2 Low | 3 Moderate | 4 High | 5 Very High |
|---|---|---|---|---|---|
| 5 Very High | 5 | 10 | 15 | 20 | 25 |
| 4 High | 4 | 8 | 12 | 16 | 20 |
| 3 Moderate | 3 | 6 | 9 | 12 | 15 |
| 2 Low | 2 | 4 | 6 | 8 | 10 |
| 1 Very Low | 1 | 2 | 3 | 4 | 5 |
Example bands: 1 to 4 Low; 5 to 9 Moderate; 10 to 15 High; 16 to 25 Critical.
Multiplication is not the only option. NIST SP 800-30 Rev. 1 Table I-2 combines the two values with a lookup table rather than a product. In that table a Very High likelihood with a Very Low impact is still Very Low risk, and a Low likelihood with a Very High impact is Moderate. A lookup lets you weight impact more heavily than likelihood, which a straight product cannot. Whichever you choose, NIST's point stands: the organization defines the algorithm, writes it down and applies it the same way to every row.
A 3×3 matrix is a legitimate choice for a small entity or a board summary. The cost is resolution: with three levels most risks land in the middle and the ranking stops helping.
A worked scoring example
Take the payroll risk from the statement section and run it through the example scales.
Step 1, inherent rating. Assume no controls. The provider has had two multi-day outages in the last three years. The assessor judges a further outage highly likely within the assessment horizon and rates likelihood 4 (High), recording that reasoning in the rationale field. Missing payroll for a week breaches employment contracts and triggers regulatory reporting, so impact is 4 (High: severe effect on a primary function). Inherent score 4 × 4 = 16, Critical on the example bands.
Step 2, existing controls. Three controls link to the risk: a contractual service credit (acts on the consequence, weak), a documented manual payroll runbook (acts on the consequence), and a quarterly test of that runbook against a copy of the last payroll file. The last test passed. The assessor records the control IDs and the test result.
Step 3, residual rating. The controls do not change how often the provider fails, so likelihood stays at 4. They do change the consequence: a tested manual run pays most staff within two days. Impact drops to 2 (Low). Residual score 4 × 2 = 8, Moderate.
Step 4, evaluate against appetite. The appetite statement says operational risks to statutory obligations must sit at Moderate or below. The residual is within appetite, so the treatment option is Accept, with monitoring, and the approver's name and date go on the row. Had the appetite said Low, the owner would open an action (for example, contracting a second provider) with a target residual of 4.
Step 5, set the indicators. Two KRIs link to the row: provider incidents per quarter (watches the cause) and days since the last successful runbook test (watches the control). A threshold breach re-opens the assessment before the annual cycle.
What makes this auditable is that the rationale, the control evidence, the appetite comparison and the approval are all on the row, not in someone's email.
Inherent, residual and target risk
Three views of the same risk appear in most registers, and confusing them is the most common cause of a board pack nobody trusts.
- Inherent risk is the level with no risk response in place. NIST IR 8286 notes that OMB A-123 describes it as conditions in the absence of risk management actions, and that because some mitigation almost always exists, NIST itself calls the first rating the current risk.
- Residual risk is the level that remains after risk response has been applied (NIST IR 8286, 3.5.2). NIST says it is calculated with the same method as the current risk, and that if it is still outside the acceptable level the owner should add controls or consider avoiding the risk.
- Target risk is where the organization has decided the residual should be once planned actions complete. It is not in the NIST template, but without it the register cannot show whether an open action plan is enough.
Two rules. The gap between inherent and residual is a claim about control effectiveness, so a control that has never been tested should not reduce the score. And because inherent ratings are hard to defend for some risks (what is the inherent likelihood of fraud with no controls at all?), many programs record current and residual and skip the theoretical baseline. Either is acceptable if the methodology says which. For the terms, see What is residual risk?.
Treatment options and the acceptance decision
ISO 31000:2018 clause 6.4.4 makes risk evaluation a comparison: the results of the analysis are set against the risk criteria to decide whether more action is needed. The outcome can be to do nothing further, to consider treatment options, to analyze further, to maintain existing controls, or to reconsider the objective itself.
For treatment, ISO 31000:2018 clause 6.5.2 lists options that include avoiding the risk, taking or increasing risk to pursue an opportunity, removing the risk source, changing the likelihood, changing the consequences, sharing the risk (for example through contracts or insurance), and retaining the risk by informed decision. NIST IR 8286 collapses the negative-risk options to four, accept, transfer, mitigate and avoid (Table 3), and adds four for positive risks: realize, share, enhance and accept (Table 5).
Use one vocabulary in the register and map it to the other in the methodology document. The trap is "mitigate" as a default that never gets a plan. If the option is mitigate, the row must link to at least one action with an owner and a due date; if it is accept, the row must hold the approver and the date. Risk Acceptance in GRC covers who may accept what.
How to run the assessment cycle: owners and cadence
NIST SP 800-30 Rev. 1 organizes risk assessment into four steps: prepare, conduct, communicate results, and maintain (section 3). ISO 31000:2018 wraps the same work in communication and consultation (6.2) at the front and monitoring and review (6.6) at the back. A register cycle that follows them looks like this.
Prepare (annually; second line). Confirm the scope, taxonomy, scales, bands and appetite thresholds. NIST Task 1-5 is to identify the risk model and analytic approach before assessing anything. Version the methodology and stamp the version on every row assessed under it.
Identify (continuous; consolidated quarterly). New rows arrive from RCSA campaigns, audit findings, incidents, the BIA, regulatory change and scenario workshops, each with a source and date. The second line de-duplicates against the taxonomy; see How to Build a Common Risk and Control Taxonomy.
Assess (quarterly for Critical and High, annually for the rest; risk owner with second-line challenge). The owner rates likelihood and impact against the anchors, records the rationale, links the controls and their latest test results, and derives the residual. The second line reviews for consistency across owners and returns rows whose rationale does not support the rating.
Evaluate and decide (quarterly; risk committee). Compare residual to appetite, approve acceptances at the level policy sets, open actions for the rest. This is COSO ERM 2017 principles 12 and 13 (prioritizes risks; implements risk responses) in practice.
Communicate (quarterly to the committee; at least twice a year to the board). NIST Step 3 exists because the assessment is not finished until decision makers have the results. Report movement, what changed and why, not just the current heat map. How to Build a Risk Appetite Dashboard for Executives covers the reporting layer.
Maintain (continuous; triggered). NIST Step 4 asks for ongoing monitoring of risk factors and an updated assessment when they change. In register terms, a KRI breach, a failed control test, an incident or a material business change re-opens the row outside the calendar.
Roles matter more than dates. Every row needs one accountable owner, usually in the first line; a second-line reviewer; and a named approver for acceptances. Registers where "Risk Management" owns every row are registers nobody owns.
Common mistakes
- Scoring categories instead of events. "Cyber" cannot be rated. Rewrite as cause, event, consequence before scoring.
- Word-only scales. Without frequency and currency anchors, ratings drift between assessors. NIST SP 800-30 Rev. 1 section 2.3.2 names the problem and the remedy: define each value with examples and require a rationale.
- Reducing the score for untested controls. A control that lowers residual risk needs a test or self-assessment result on record. Otherwise the residual is a hope.
- Multiplying when you should look up. A product treats 1 × 5 and 5 × 1 as the same risk. If appetite cares more about impact than frequency, use a lookup table like NIST Table I-2.
- Changing the bands to change the picture. Re-banding after assessment so fewer risks show as red is the fastest way to lose the board's trust. Version the methodology and re-score if it changes.
- One register for everything. Project risks with two-week horizons and enterprise risks with three-year horizons do not belong on one scale. Keep separate registers with a common taxonomy and a roll-up, as NIST IR 8286 describes for cybersecurity registers feeding the enterprise register.
- No review date, or a team as owner. A row with no next review still says the same thing in three years; a row owned by a mailbox has nobody accountable. ISO Guide 73:2009 defines the risk owner as a person or entity with accountability and authority.
- A spreadsheet with no links. Once controls, issues and KRIs live in other files, the register cannot show why a score changed. See From Spreadsheet GRC to Connected GRC.
How the register links to controls, issues, KRIs and the BIA
A register earns its keep through its relationships. Four matter most.
Controls. Each risk links to the controls that modify it, and each control links to its latest test result. ISO 31000:2018 lists the effectiveness of existing controls among the factors to consider in risk analysis (6.4.3), so this link is what justifies the residual rating. When a control test fails, the residual should move without anyone re-keying it.
Issues and actions. A treatment plan is a set of issues with owners and due dates. Linking them lets the register show "three open actions, one overdue" against a risk, and lets the issue log show which risk each action reduces. How Issues Management Becomes the Backbone of Connected GRC covers the issue side.
KRIs. Key risk indicators watch the causes on the left of the risk statement and the controls in the middle. A KRI with a threshold, linked to a risk, turns the annual cycle into a monitored one. See What is KRI monitoring?.
The BIA. The business impact analysis says which processes and services matter most and what impact tolerance each has. Linking a risk to the process it threatens lets you inherit the impact rating from the BIA rather than guess it, and lets resilience teams see which risks sit on critical services. Business Impact Analysis in Connected GRC explains the BIA side; Risk Appetite vs Risk Tolerance vs Impact Tolerance explains why impact tolerance and risk appetite are different thresholds.
The data model behind these links is described in The Connected GRC Data Model: Core Records.
Risk register vs risk matrix vs heat map
The three terms get used as if they were one thing. They are not.
| What it is | What it holds | When you use it | |
|---|---|---|---|
| Risk register | The record of identified risks and decisions about them | One row per risk with all the fields above | Continuously; it is the system of record |
| Risk assessment matrix | The scoring rule that combines likelihood and impact into a level of risk | Scales, the combination rule and the bands | When you define the methodology and each time you rate a risk |
| Heat map | A chart that plots the register's risks on the matrix grid | The current score of each risk, and nothing else | When you report; it is one view of one field |
A heat map without a register behind it is a drawing; you cannot click a red square and see the owner, the controls or the actions. A register without a written matrix is a set of opinions; two assessors will score the same risk differently and nobody can say who is right. Build them in the order register schema, then matrix, then heat map.
Quantitative alternatives in brief
Everything above is qualitative or semi-quantitative. NIST SP 800-30 Rev. 1 (2.3.2) describes the three approaches: quantitative assessments use numbers whose meaning holds outside the assessment and support cost-benefit analysis, but their rigour drops when subjective judgements are buried inside them; qualitative assessments use categories and communicate well but compare poorly; semi-quantitative assessments use bins or scales (NIST's 0 to 100 bands are an example) to get some of both.
The main fully quantitative method in general use is Open FAIR, published by The Open Group as the Risk Taxonomy (O-RT) Standard, Version 3.0.1 (C20B) and the Risk Analysis (O-RA) Standard, Version 2.0.1 (C20A). FAIR defines risk in terms of how often loss events will probably occur and how large the loss will probably be, within a stated period. It decomposes loss event frequency into threat event frequency and vulnerability, and threat event frequency into contact frequency and probability of action; vulnerability compares threat capability with resistance strength. Loss magnitude splits into primary loss to the organization and secondary loss involving other stakeholders, across six forms: productivity, response, replacement, fines and judgments, competitive advantage, and reputation. Inputs are estimated as ranges, and the output is a distribution of loss in currency rather than a score.
Use it for the few risks where a decision turns on money (insurance limits, a control investment, a vendor exit) and where frequency and loss data exist. Do not use it to replace the register: keep the qualitative register as the system of record and record FAIR results on the rows that justify the effort. Cyber Risk Quantification vs Cyber Risk Management sets out where quantification fits; Understanding risk analysis: quantitative vs qualitative defines the terms.
How SmartSuite does this
SmartSuite's Enterprise Risk Management (ERM) product holds the register as a set of related records rather than a table. Each risk links to its controls, incidents, audit findings, issues and KRIs, so the residual rating, the open actions and the indicator status show on the risk record and roll up to dashboards without re-keying. The scoring model is configurable: you set the likelihood and impact scales, the combination rule and the bands, and the product page lists alignment with COSO ERM, ISO 31000, NIST RMF and the CRI Profile. Workflow automation runs the cycle above: assessments are assigned by owner and cadence, approvals and escalations are routed, and KRI thresholds trigger alerts.
The campaigns that feed the register run in Risk and Control Self-Assessment (RCSA), which supports configurable qualitative and quantitative scoring, control effectiveness evaluation with evidence, automated assignment and escalation, and inherent and residual views on the same risk, control and issue records. Related products cover the other links in this guide: Business Impact Analysis (BIA), Issues Management and Control Framework & Regulatory Libraries. For how the pieces fit, see Enterprise Risk Management in a Connected GRC Program.
Template
The companion file risk-register-template.csv has 36 columns and two completed example rows: the payroll risk above and a third-party data-breach risk. Import it into a spreadsheet to start, or use it as the field list when you configure a register in a GRC tool.
| Column group | Columns |
|---|---|
| Identity | risk_id, title, risk_statement, category, business_unit, objective_affected, source, date_identified |
| Ownership | risk_owner, second_line_reviewer |
| Inherent view | inherent_likelihood (1 to 5), inherent_impact (1 to 5), inherent_score, inherent_rating |
| Controls | linked_control_ids, control_effectiveness, last_control_test_date |
| Residual view | residual_likelihood, residual_impact, residual_score, residual_rating, rating_rationale |
| Evaluation | appetite_threshold, within_appetite, treatment_option, approver, approval_date |
| Treatment | linked_action_ids, target_residual_score, target_date |
| Monitoring | linked_kri_ids, linked_bia_process, last_assessed, next_review, status, methodology_version |
Scores in the example rows use the 1 to 5 scales and example bands from this guide. Change the bands in your methodology document first, then in the file.
FAQs
What is the difference between a risk register and a risk assessment? The assessment is the activity: identifying, analyzing and evaluating risk, which ISO 31000:2018 groups under clause 6.4. The register is the record of what that activity found and decided. A register with no dated assessment behind each row is a list of worries; an assessment that is not recorded cannot be reviewed, challenged or audited.
How often should a risk register be updated? Set a calendar cadence and a set of triggers. Quarterly for Critical and High risks and annually for the rest is common. NIST SP 800-30 Rev. 1 makes maintaining the assessment its fourth step, driven by ongoing monitoring of risk factors, so a KRI breach, a failed control test, an incident or a material business change should re-open a row between scheduled reviews.
Does ISO 31000 require a 5×5 risk matrix? No. ISO 31000:2018 asks you to define risk criteria (6.3.4), including how likelihood and consequences will be measured and how the level of risk is determined, and says analysis can be qualitative, quantitative or both (6.4.3). It does not prescribe a grid. NIST SP 800-30 Rev. 1 offers five-level scales as examples that organizations are expected to tailor.
Should the register show inherent or residual risk? Both, if you can defend the inherent figure with a consistent "no controls" assumption. NIST IR 8286 prefers "current risk" as the baseline because some mitigation almost always exists, and defines residual risk as what remains after risk response. Whichever baseline you use, state it in the methodology and apply it to every row.
What makes a risk score defensible to an auditor? Four things on the row: anchored scales (frequency and currency, not just words), a written rationale for the chosen values, links to the controls and their latest test results that justify the residual, and the appetite comparison with a named approver. NIST SP 800-30 Rev. 1 attributes most inconsistency in qualitative scoring to undefined values and missing rationale.
How many risks should an enterprise register hold? There is no standard number. NIST IR 8286 distinguishes the risk profile, a prioritized inventory of the most significant risks, from a complete inventory. Keep detailed registers at business-unit or domain level, aggregate through a common taxonomy, and report the profile, typically the risks outside appetite plus the top movers, to the committee and board.
Sources
- ISO 31000:2018, Risk management — Guidelines, second edition, International Organization for Standardization, February 2018. Catalog: https://www.iso.org/standard/65694.html. Preview with clause 3 definitions and table of contents: https://cdn.standards.iteh.ai/samples/65694/7ced163880234659809e5202d306b3a4/ISO-31000-2018.pdf. SmartSuite framework page: https://www.smartsuite.com/frameworks/iso-31000-risk-management-guidelines-2018
- ISO Guide 73:2009, Risk management — Vocabulary (definition of risk owner, 3.5.1.5, as cited in the ISO 31000 preview above). https://www.iso.org/standard/44651.html
- NIST SP 800-30 Rev. 1, Guide for Conducting Risk Assessments, National Institute of Standards and Technology, September 2012. Sections 2.3.2 and 3; Tables G-2, G-3, H-3, I-2, I-3. https://csrc.nist.gov/pubs/sp/800/30/r1/final (PDF: https://nvlpubs.nist.gov/nistpubs/Legacy/SP/nistspecialpublication800-30r1.pdf)
- NIST IR 8286, Integrating Cybersecurity and Enterprise Risk Management (ERM), National Institute of Standards and Technology, October 2020. Section 3, Figure 4, Tables 2, 3 and 5, section 3.5.2. https://csrc.nist.gov/pubs/ir/8286/final (PDF: https://nvlpubs.nist.gov/nistpubs/ir/2020/NIST.IR.8286.pdf)
- COSO, Enterprise Risk Management — Integrating with Strategy and Performance, Executive Summary, Committee of Sponsoring Organizations of the Treadway Commission, June 2017. Five components and twenty principles. https://www.coso.org/guidance-erm (PDF: https://www.coso.org/_files/ugd/3059fc_61ea5985b03c4293960642fdce408eaa.pdf). SmartSuite framework page: https://www.smartsuite.com/frameworks/coso-enterprise-risk-management-framework-2017
- The Open Group, Risk Taxonomy (O-RT) Standard, Version 3.0.1, C20B, November 2021. https://publications.opengroup.org/c20b
- The Open Group, Risk Analysis (O-RA) Standard, Version 2.0.1, C20A. https://publications.opengroup.org/c20a
- The Open Group, Technical Standard: Risk Taxonomy, C081, January 2009 (component definitions, section 5.2; forms of loss, 5.2.10). https://pubs.opengroup.org/onlinepubs/9699919899/toc.pdf
- The Open Group, The Open FAIR Body of Knowledge. https://www.opengroup.org/open-fair
- OMB Circular A-11 and OMB Circular A-123, US Office of Management and Budget, as quoted in NIST IR 8286 for the typical contents of a risk register and the definition of a risk profile.
Related: GRC Foundation · What is a risk register? · What is risk appetite? · What is RCSA? · ISO 31010:2009 risk assessment techniques
Frequently asked questions

More guides
GRC and resilience