Dashboards
Build powerful, visually thrilling views into your information. Gain visual insight into the performance of any team, process or project, and make smarter business decisions.
.jpg)
Visualize Your Work with Dashboards

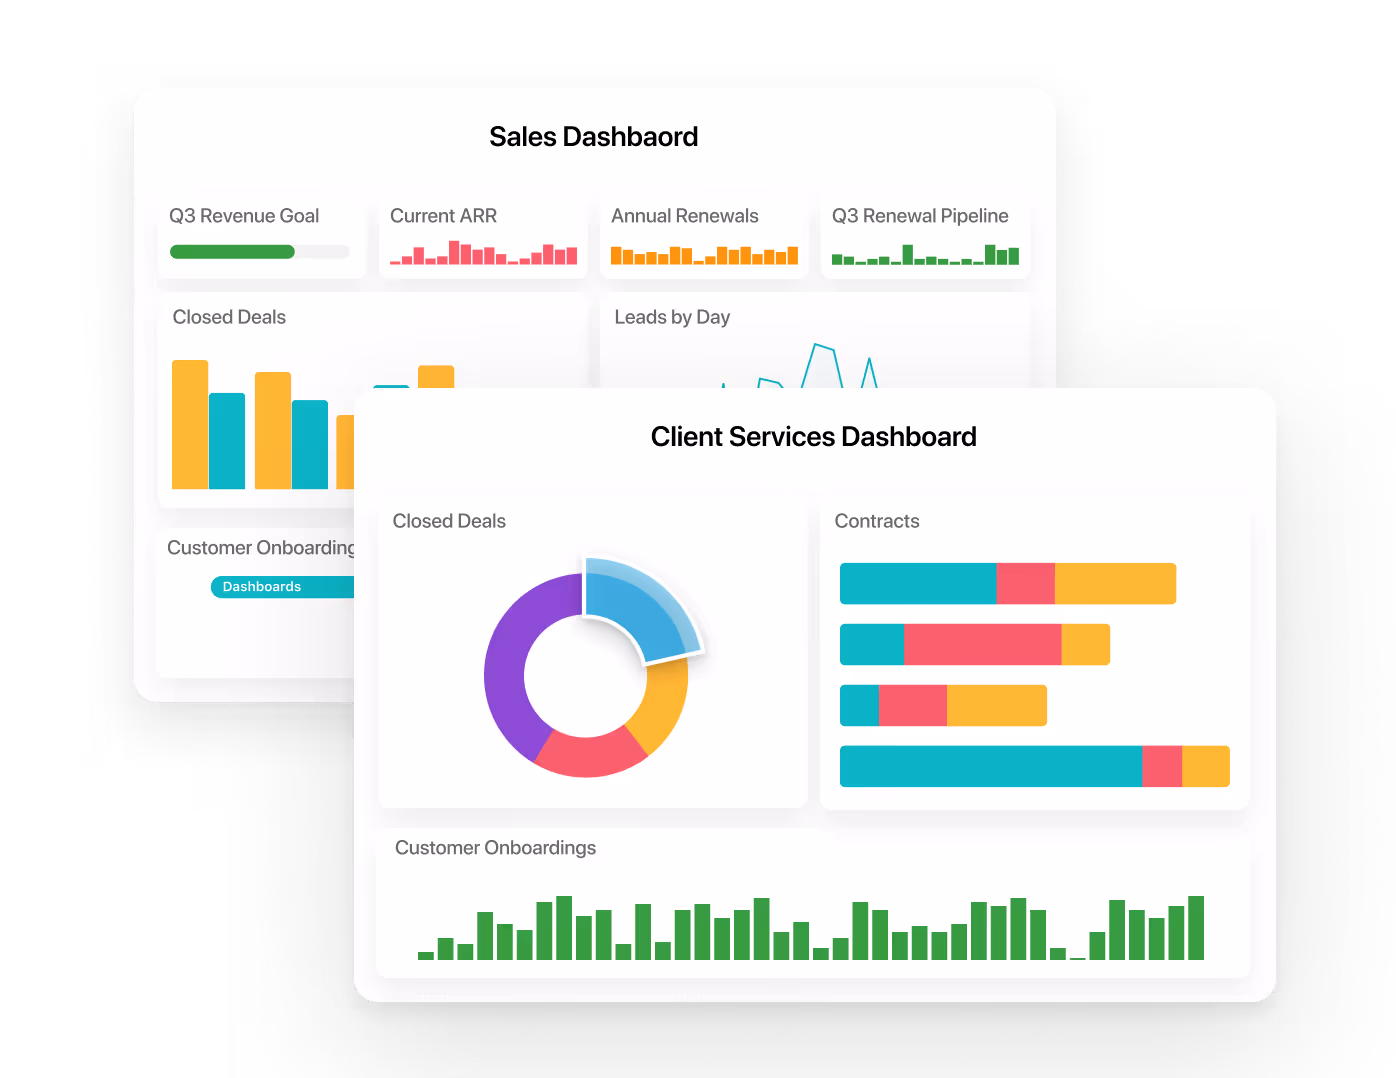
Supercharge Your Teams
With Dashboards
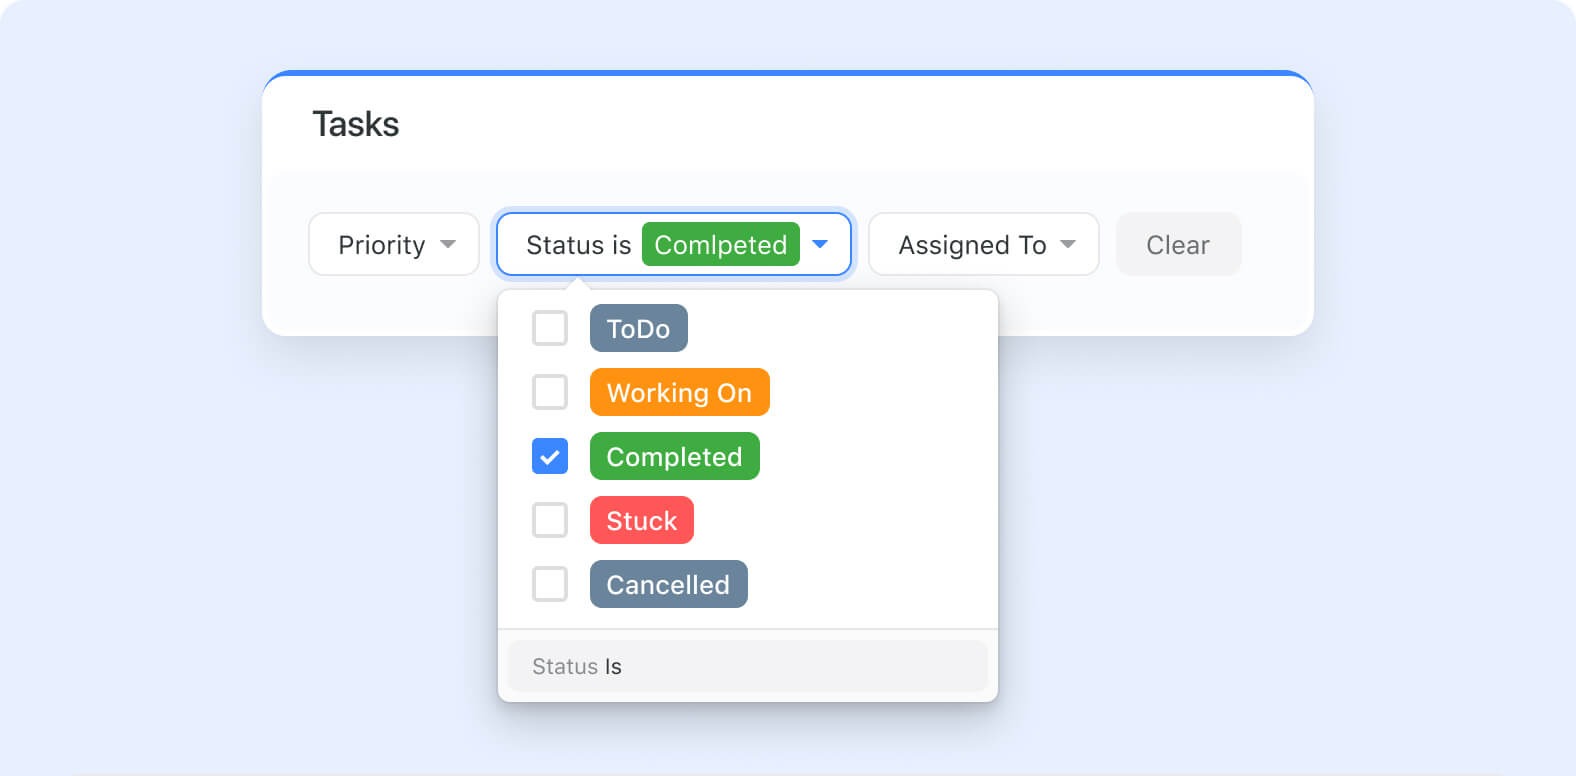
Aggregate any of your data into a single view using a comprehensive library of easy-to-configure visuals. No more digging for information - it’s right there in all of its glory, however you choose to display it.
Understand relationships, evaluate dependencies, and track metrics that measure the state of your business.
The possibilities are limitless, from teams unifying around shared priorities, to leaders maintaining a pulse on all parts of their organization. Work smarter in all facets of your organization.

Dashboards For Every
Department and Team
Create dashboards to visualize information at each “layer” of your organization. Executive leaders, departments, teams, programs, projects, clients, and even individuals can have their own dashboards with the data they need.

Track Key Metrics &
Data in Charts
Use dynamic widgets to embed charts, calculate and track metrics, or summarize in tables.

Easily Build
The Perfect Dashboard
Our Widget Library makes it easy to tailor any dashboard to the specific project or process you’re working on. In just a few clicks, add charts, metrics, text, file links, announcements, and more. Customize to your heart - and brain’s - desire.

Bring Your Tools
Into One Dashboard
It’s not just SmartSuite items you can add to dashboards. From websites to custom HTML, embed social media feeds, docs from Google Drive or Microsoft Office, Jira, and Confluence, putting key information from adjacent systems at your teams' fingertips. You might even be able to close a tab or two.
How Customers Use Dashboards
Explore the power of Dashboards and get inspired by real-world applications to see how they can go to work for you.
Dashboard Widgets
Start with your favorite metrics and go from there - our dashboards offer WAY more than just analytics.

Text
Add a single line of text like a name or title.

Announcements
Post company-wide, departmental or team announcements to keep everyone in the know.

Conversations
Run your Agile standup meetings directly in your teams' dashboards. Perfect for remote organizations.

File Listing
Upload important files and images as links for members to access in a click.

Charts
Bring your dashboard alive with interactive, visual representations of your data.

Countdown
Count down to a product release, end of the quarter or any big event.

World Clock
See the time at your colleague, customer or partner locations at a glance.

Metrics
Rollup key metrics from any solution to quantify projects or processes at-a-glance.

Report Listing
Create quick links to internal SmartSuite reports.

Tables
Drop in tables to summarize records and data.

Grid View
Integrate any Grid View directly in dashboards.

Card View
Visualize important items with Card View.

Map View
The physical world meets digital with Map View embedded into any dashboard. See all your locations visualized.

Calendar View
Track key milestones, color code activities by date to stay on top of workflow.

Timeline View
Plan and stay proactive with visual, interactive timelines.

Kanban View
Push and pull process workflow with Kanban View directly in a dashboard.

Custom Embed
Embed custom HTML, web pages, apps - anything - directly into your dashboard.

Links Listing
Create a list of internal or external website links.
Widgets. Fun to say. Powerful to use.
Start using powerful Dashboards and unlock fresh insights today.