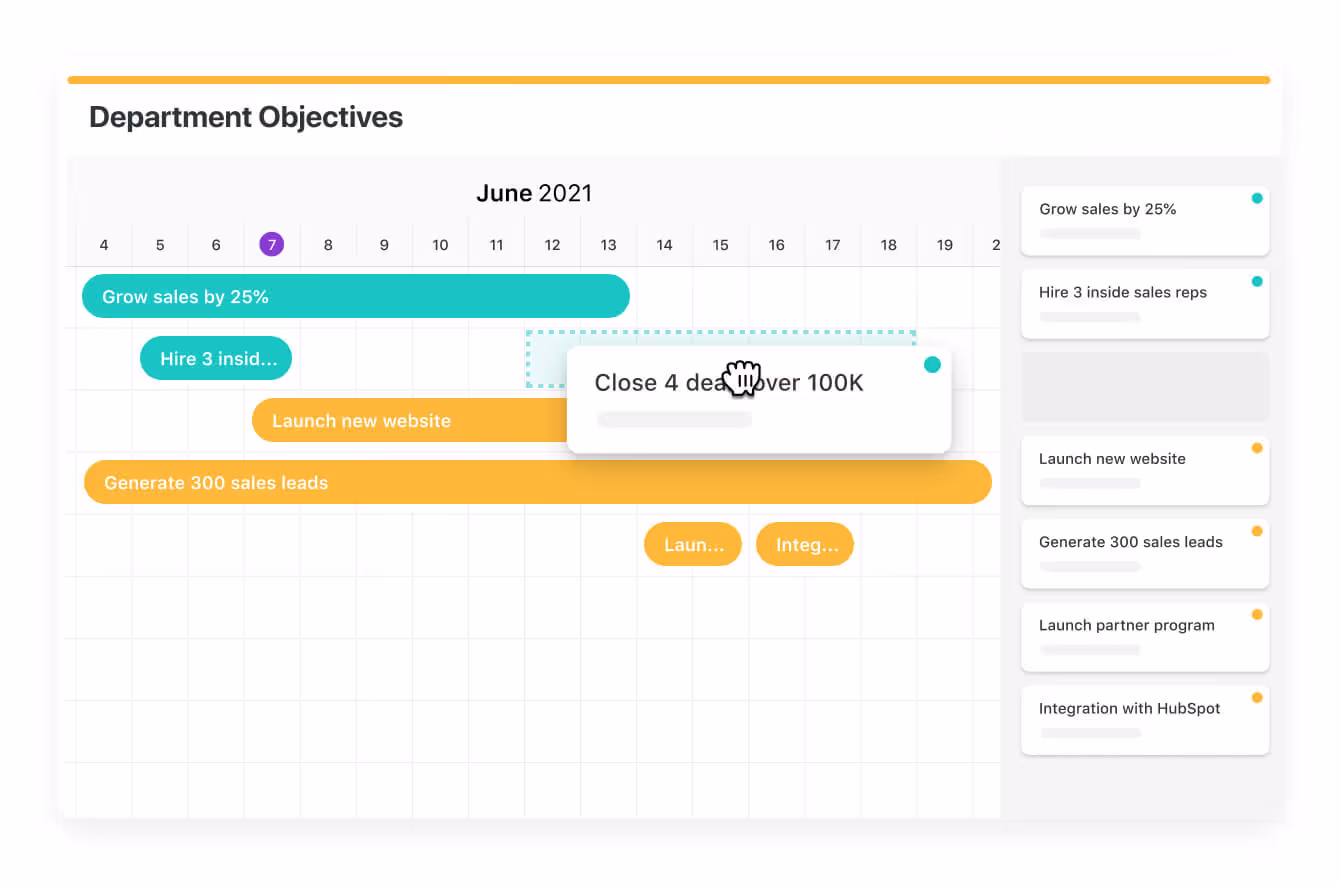
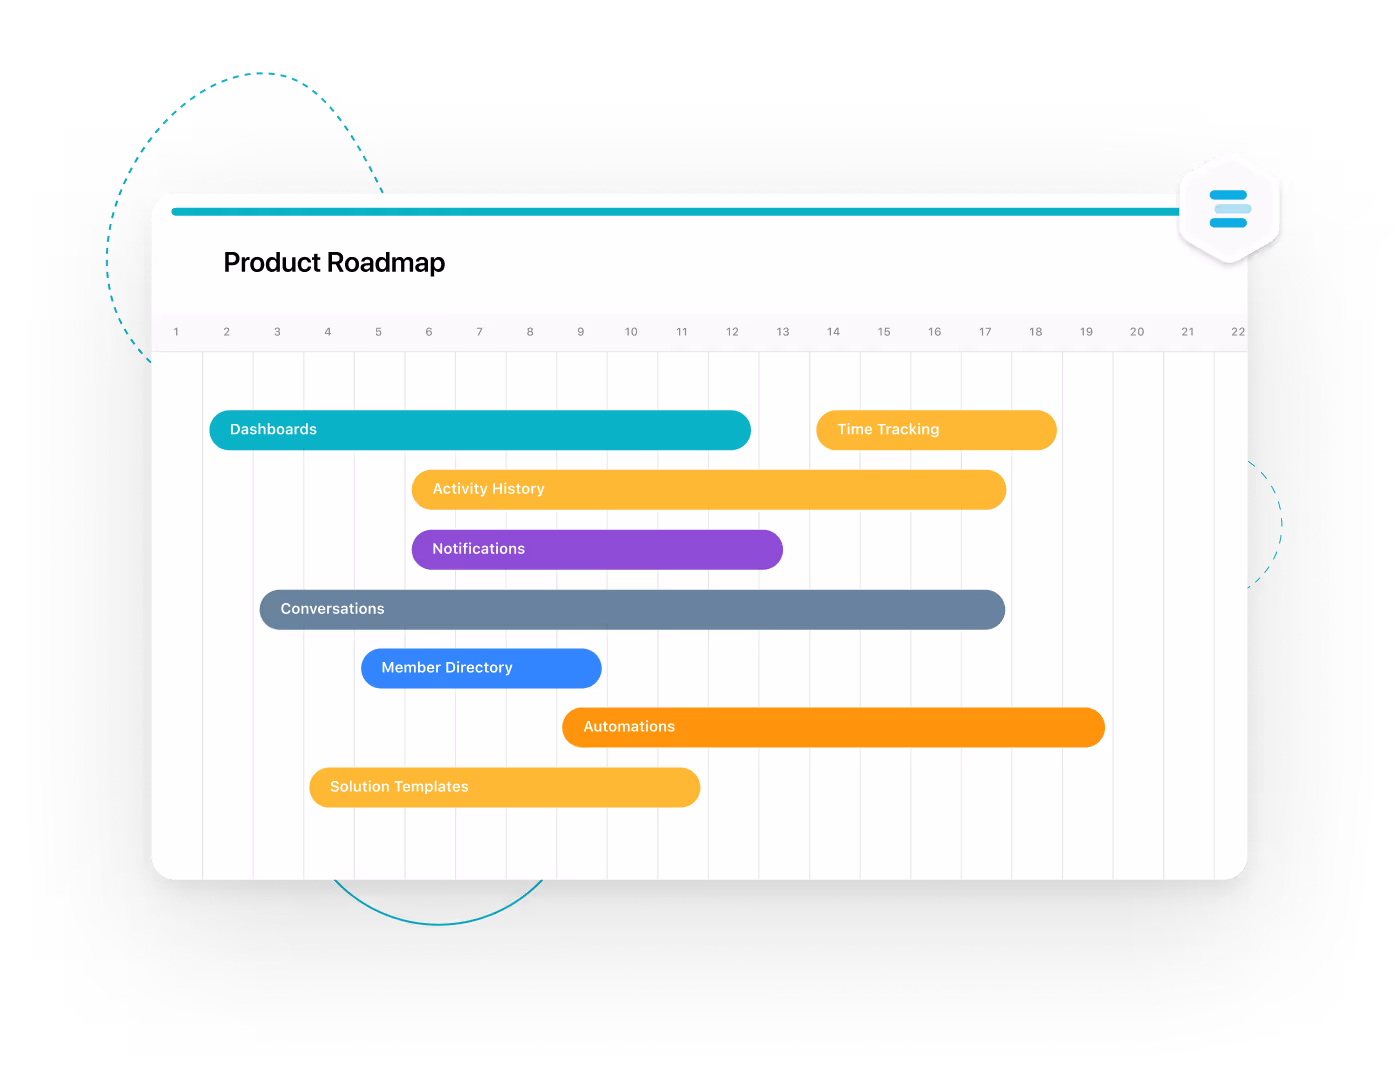
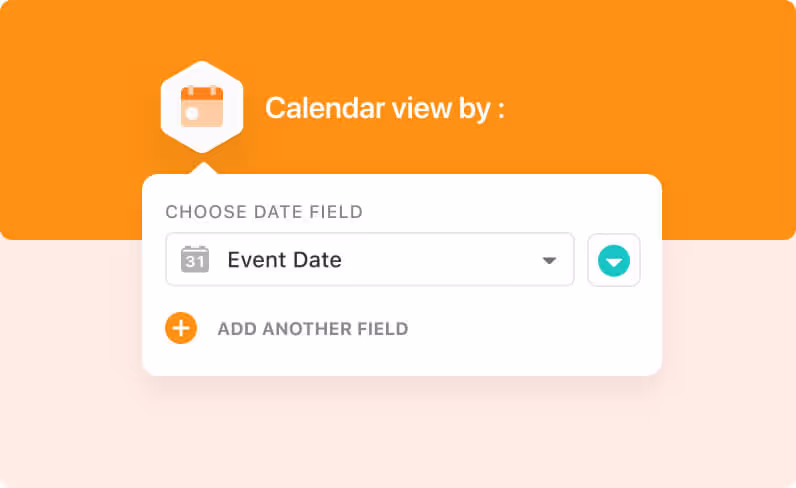
Timeline View
View your projects and processes in a timeline format that is great for visualizing workstreams and schedules over a custom period of time.

Visualize Your Upcoming Work And Projects

View Work By
Date Range
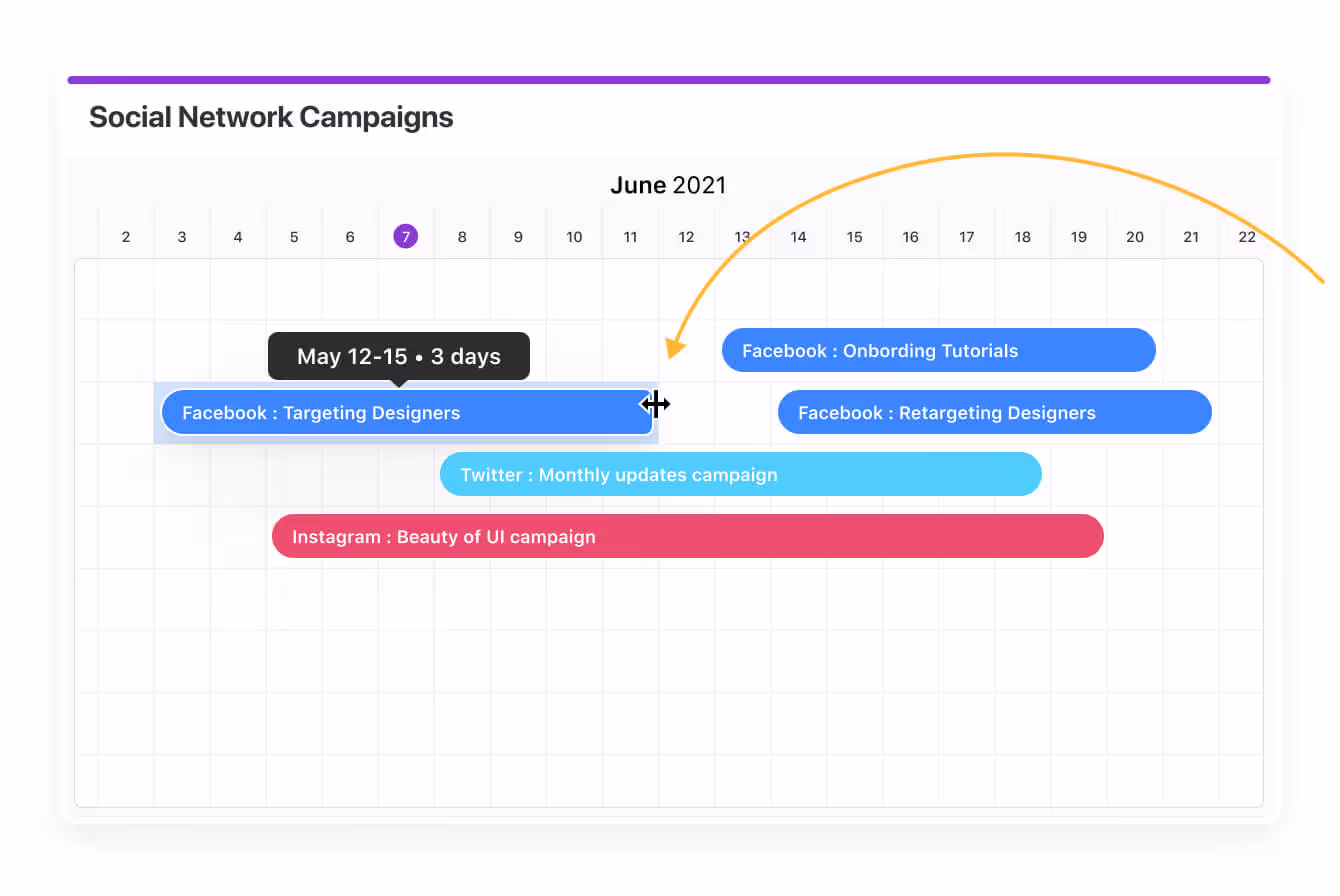
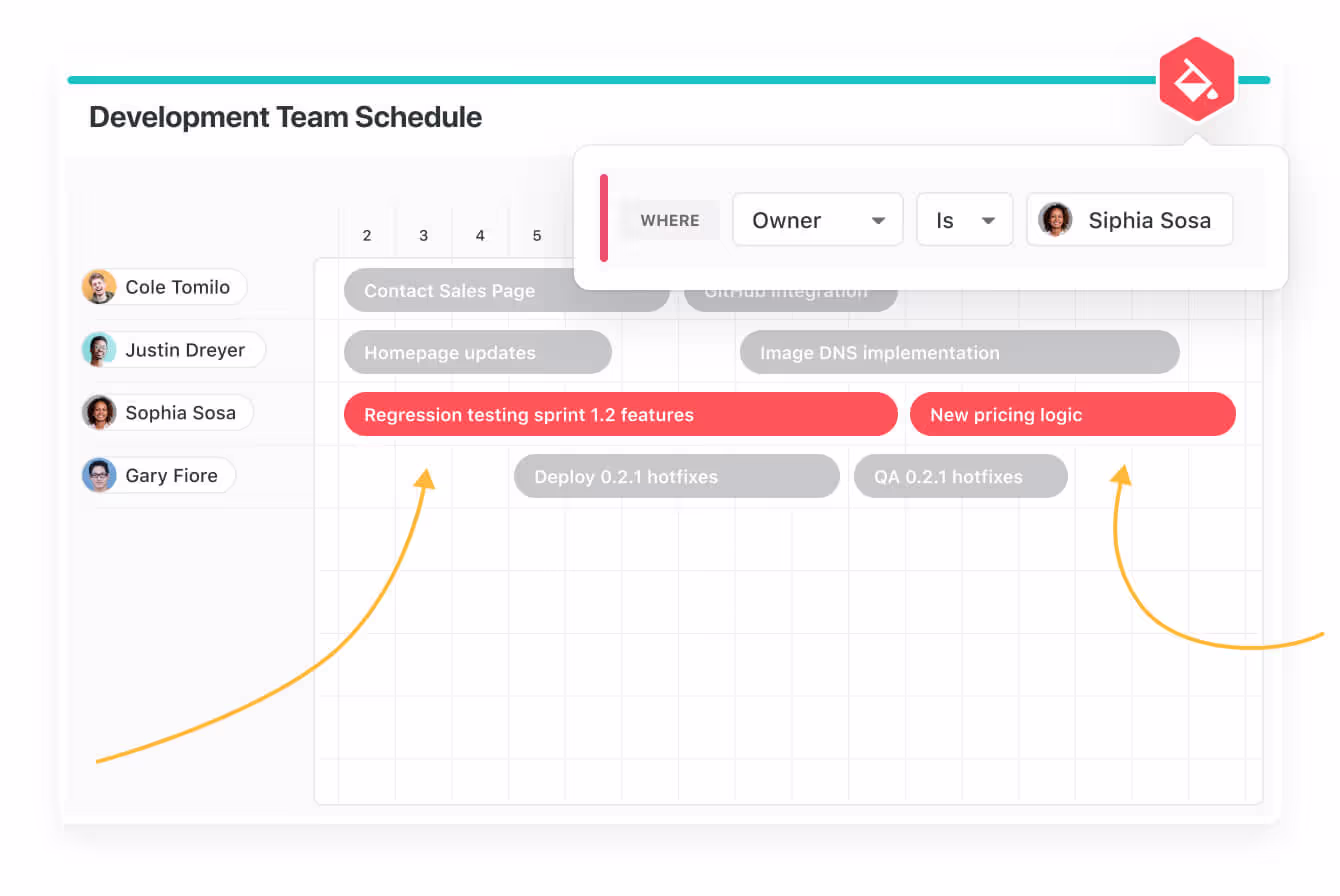
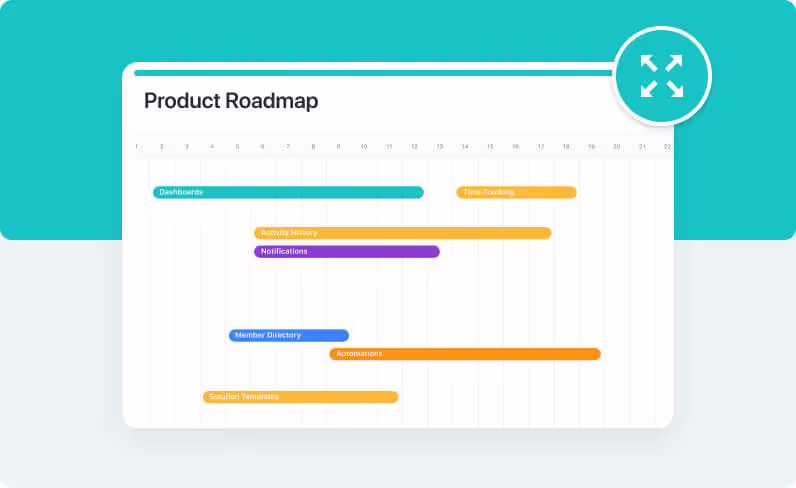
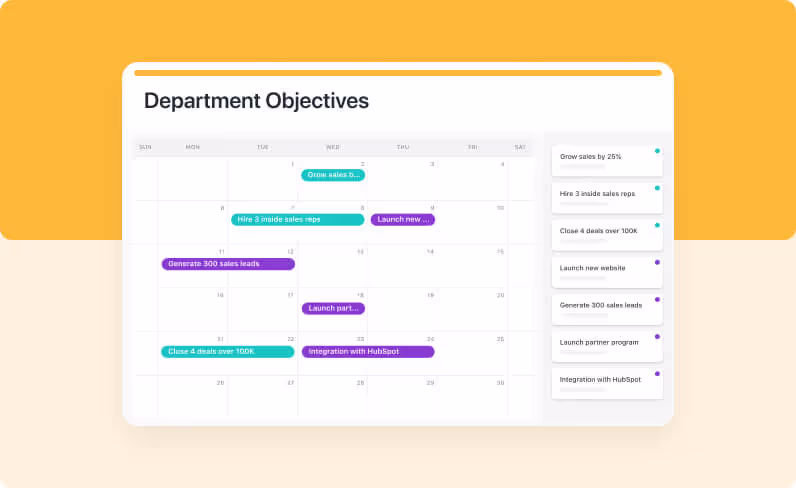
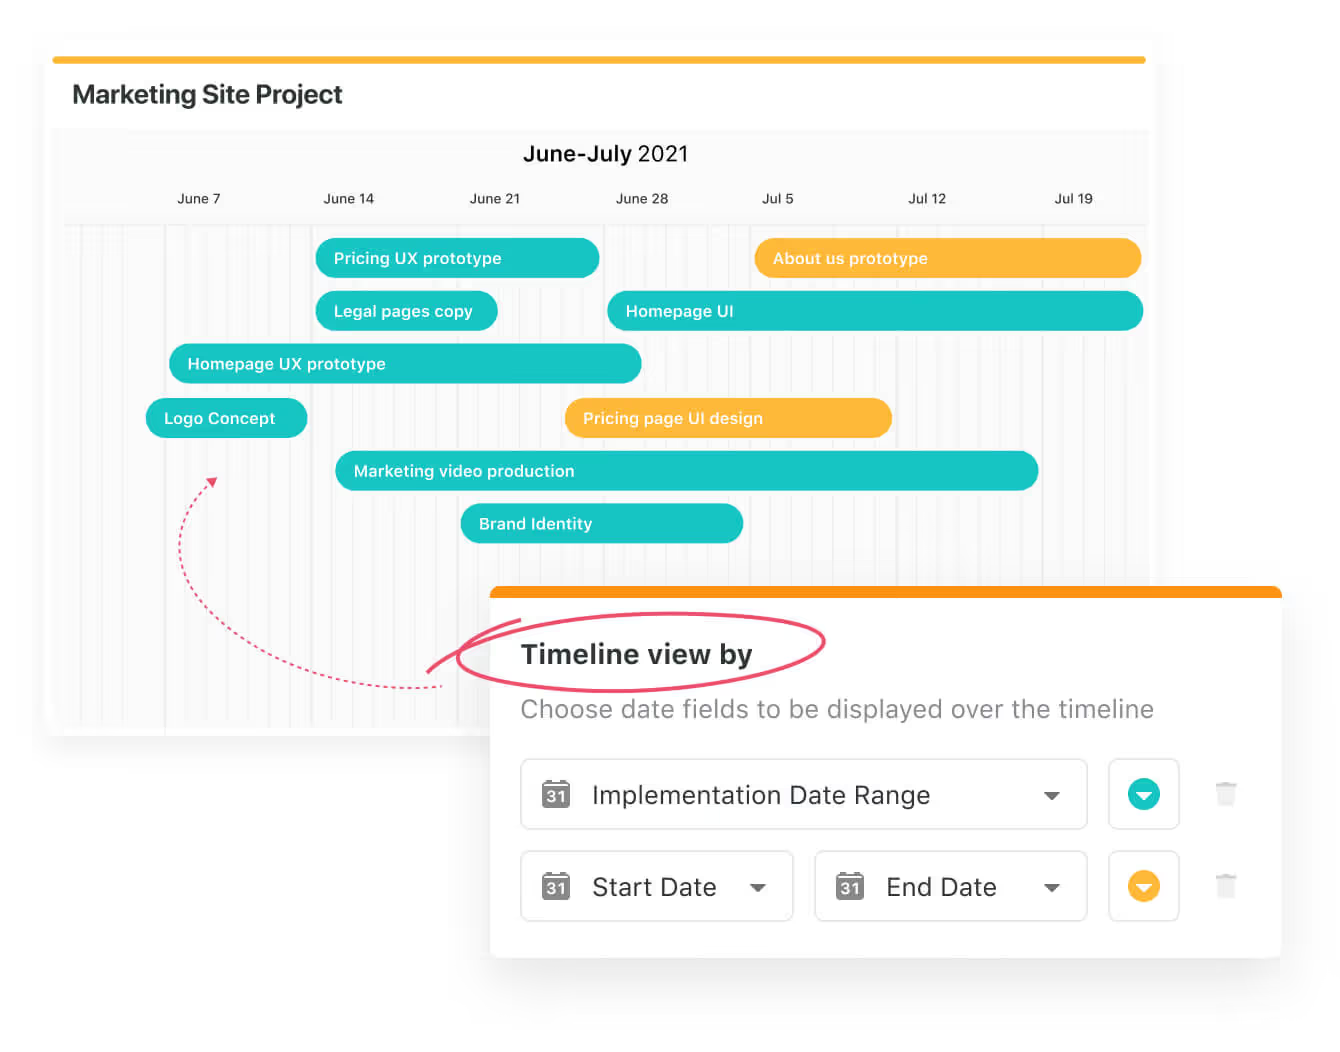
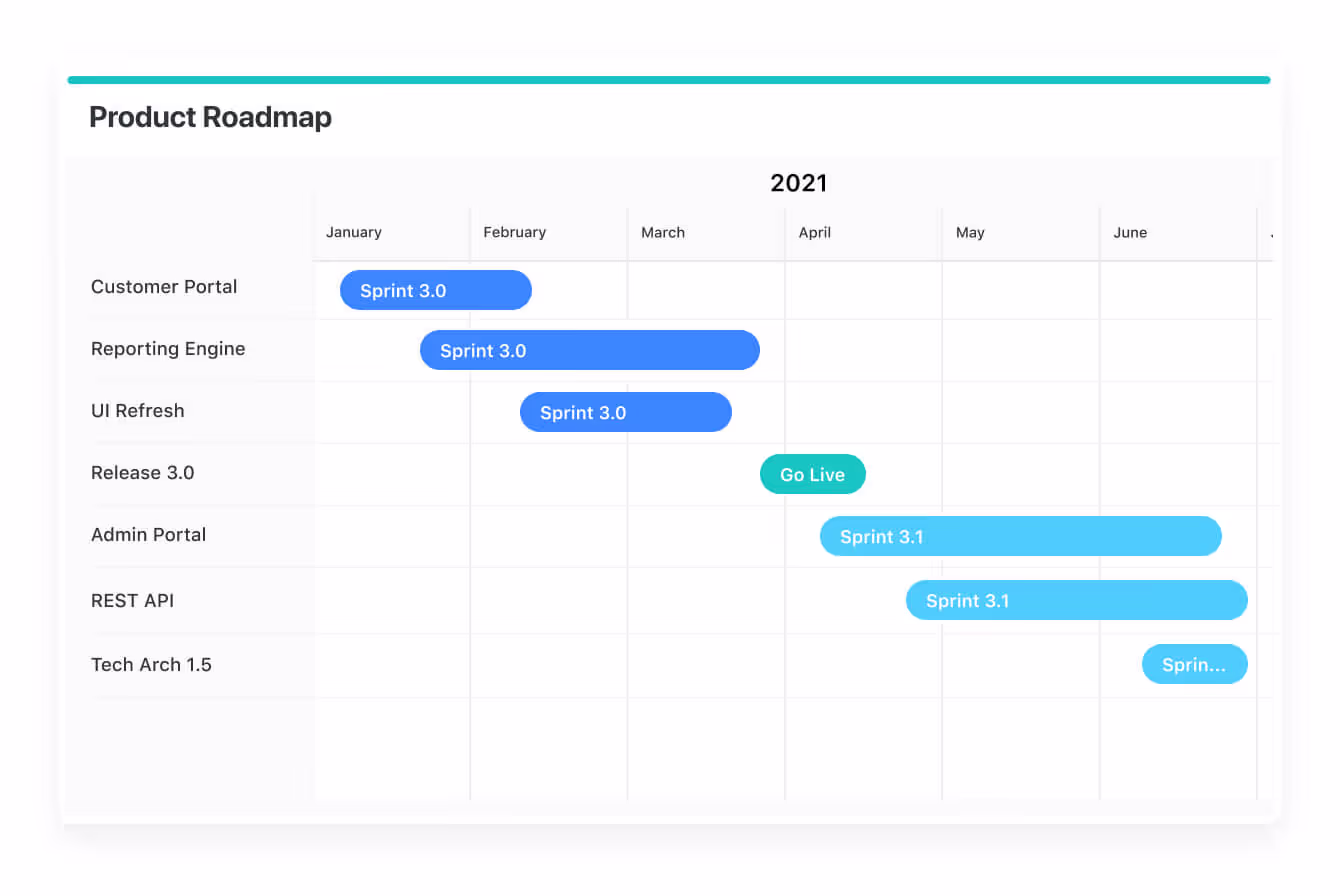
Choose the date range you want to display and color coordinate tasks. Use this view in order to identify dependencies, manage competing priorities and stay proactive on your deadlines. Simple drag and drop capabilities allow you to adjust dates on the go.

Group Items Like A
Gantt Chart
Are you one of those Gantt fanatics? Visually group by any attribute to create a Gantt-like view. This is particularly useful in viewing data with shared attributes, such as project tasks in teams, marketing campaigns in social media channels, or product features in development sprints.
.jpg)
View All Your
Records And Tasks
One click opens the Record Listing panel, which displays all available data in your selected view. Use reporting toolbar controls such as Sort, Group, and Spotlight to locate records, then drag and drop items directly into the view. PMs love this for quickly scheduling tasks and ensuring nothing is missing a due date.

Shift The Display To
Months, Weeks Or Days
Shift between Today, Hours, Days, Weeks, Months simply by clicking on the interactive heading to view any level of detail.
.jpg)
One Click To
See The Details
One click on a Timeline item quickly opens the record to review the details, make adjustments, and then close to jump back to the timeline. No backend updates needed; it all happens in the Timeline view.

Change Dates
Without Changing Tabs
Drag and drop items to change a date directly in Timeline View. The Record Listing panel displays a full list of every item in an application - not just what has a date field assigned to it. Drag items from the listing to the timeline and the dates in each record will be updated automatically.

Quickly Change
Start & End Dates
Adjust date ranges by grabbing the Start Date or End Date of a Timeline item to adjust in real-time, without having to open up any additional pages or jump into the task.

Color Code
Items With Spotlight
The Spotlight control is used to color code items displayed on the timeline so it's easy to find what you're looking for. Choose pretty much any search option to make your timeline light up like a Christmas tree.
How Customers Use Timeline View
Explore real-world applications of Timeline View and plan how it can go to work for you.
Report Toolbar Controls For Timeline View
Dive into the many ways you can analyze your work in timelines.

Date Selector
Select any Date-Type field to visualize records on calendars.

Sort
Sort your data in the way it makes sense for you, whether that's alphabetical, by a numeric value, by date, or something cool completely unique to you.

Filter
Filter your data by any other field, returning just the items you're looking for.

Swimlane Grouping
Use Swimlane Groupings to gather your data by the value of other fields, helping you organize and understand complex information in a wonderful Gantt Chart format.

Spotlight
Give special visual attention to important information by creating rules that match and highlight conditions or values you specify.

Find
If you're looking for a particular bit of text in your records, you can quickly use the find filter to narrow things down.

Full Screen Timeline
Maximize your SmartSuite real-estate by flipping to full screen mode for any view type.

Print / Export Reports
Print in a couple clicks, or export to PDF, CSV, Excel or Google Sheets.

Timeline Record Listing
View a listing of all the records in an application. Click any tile to jump to individual records on the timeline.
See your projects and processes clearly.
Time to get a handle on your timelines today. Let’s go! ⌛