Previous Feature
Previous Feature
Next Feature
Next Feature

Robust Reporting

Robust reporting capabilities keep teams organized to deliver projects, run their core processes, and glean insights to inform productive business decisions. Create powerful reports in a matter of minutes.

Start Free Trial
Schedule a Demo
Create reports for Marketing tasks
Feature overview video

Create powerful reports in a matter of minutes.

Find the perfect view for your information
pagination
SmartSuite grid view
SmartSuite timeline view
SmartSuite chart view
SmartSuite card view
SmartSuite map view
SmartSuite kanban view
SmartSuite calendar view
SmartSuite dashboard view
Slider Arrow Icon
Arrow Right

Report
Types

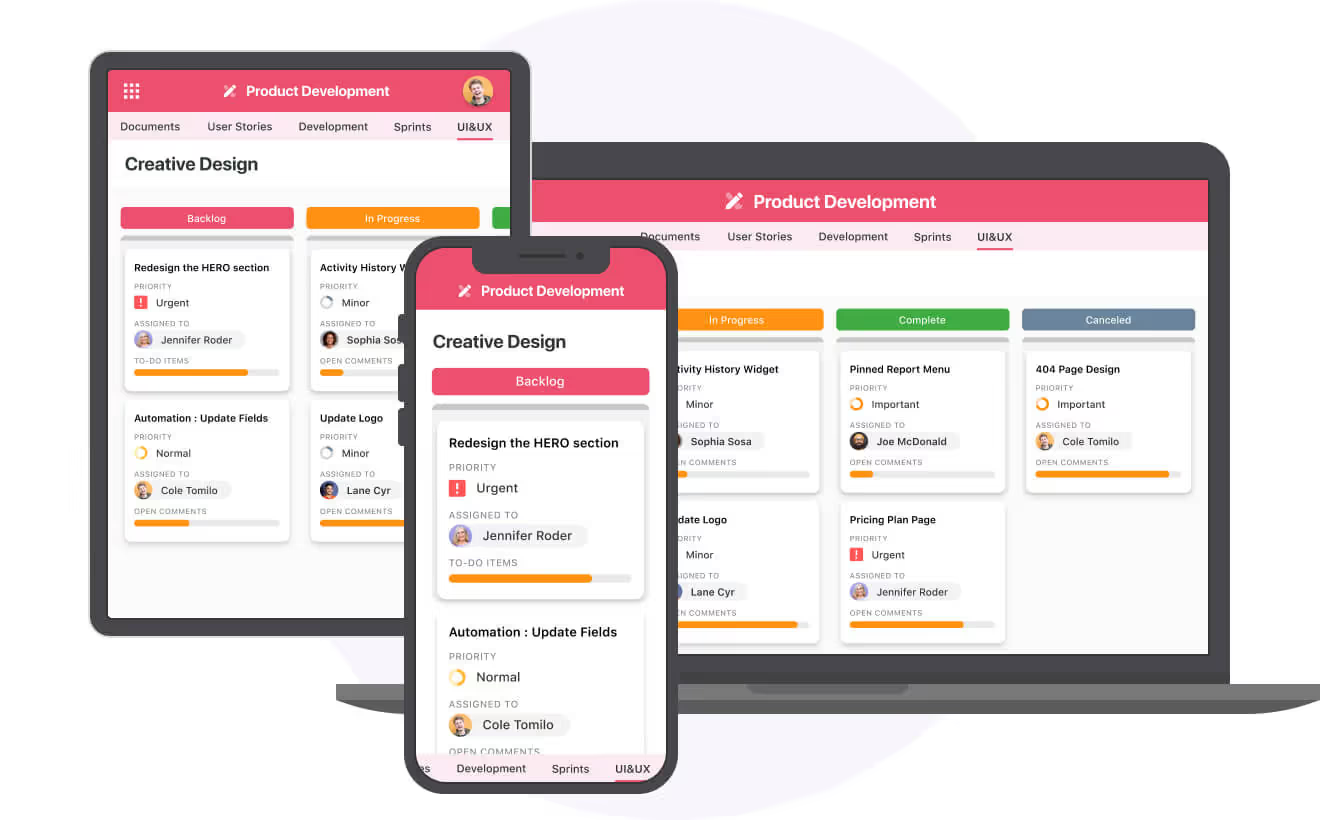
Take your data and see it in any of our Views. Change report output in a single click, adapting and testing different report styles to hit your needs at that moment. There’s no formatting on the backend - simply choose your view, review the data, and make any configuration changes in the Report Toolbar. 


View your reports in different styles, including Grid, Card, Kanban, Timeline, Map, Calendar or Dashboard.

Make a report public or keep it private
Slider Arrow Icon
Arrow Right

Create Public
Or Private Reports

Create Public Reports that are available to all users with access to a solution. These offer common views of data for collaboration across teams. 

Anyone can create Private Reports that only they can see. Test out different views, then choose to keep it for your own work process or make Public for the team. 

It's easy to access all your reports in a handy report list found in the same spot.

Adjust reports easily with the reporting toolbar
pagination
no-padding
Adjust reports easily with the reporting toolbar
Create nested sorts in reports
Apply multiple filters to a report
Group records by owner and priority in a report
Set rules to highlight data in a report
Automatically adjust row sizes in a grid report
Search for data in a report
Slider Arrow Icon
Arrow Right

Report Toolbar
Features

Every report has a standard Toolbar with consistent controls to present and analyze your data. In just a few seconds you can select the fields to display in reports, apply sorting, create filters, group items by shared attributes, and visually find items.

Star a report to mark it as a favorite
Slider Arrow Icon
Arrow Right

Star Your
Favorite Reports

We all have go-to reports that make our lives easier. Click the Star ⭐ next to any report name you have access to and pin it to your Favorites for easy access directly from your SmartSuite home page. Stop searching for reports, start searching for insights. 

Print or export any report
Slider Arrow Icon
Arrow Right

Print & Export
Your Reports

It’s your data, don’t let us stop you from accessing it how you want to! Instantly export data from any report to PDF, Excel, Google Sheets, or CSV. Print a status report for your weekly client meeting, share sales data to impress potential investors or create an employee file to upload to your payroll system. It's easy to export for any need.

Email exported reports directly to your inbox
Slider Arrow Icon
Arrow Right

Share Reports
By Email

Send your reports as email attachments, and include a deep link that will take the recipient directly to the content in SmartSuite. Add a custom message to set the context for why you're sharing.

Always forgetting to send reports? Automate your sharing by scheduling your email updates at whatever frequency you want.

SmartSuite Kanban report on a phone, tablet and web browser
Slider Arrow Icon
Arrow Right

Access Reports
On the Go

SmartSuite is Web, Tablet, and Mobile ready, so you can access your reports and key metrics from anywhere - anytime. From a plane to your dining room table, we work where you work. 

No items found.
Arrow Left
Arrow Right

Dive Deeper into the Report Toolbar Features

Report Toolbar is the go-to spot for reporting power. Available features vary by View.

Create nested sorts in reports

Sort

Sort your data in the way it makes sense for you, whether that's alphabetical, by a numeric value, by date, or something cool completely unique to you.

Apply multiple filters to a report

Filter

Filter your data by any other field, returning just the items you're looking for.

Group records by owner and priority in a report

Grouping

Group your data by the value of other fields, helping you organize and understand complex information easily.

Set rules to highlight data in a report

Spotlight

Give special visual attention to important information by creating rules that match and highlight conditions or values you specify.

Find the perfect view for your information

Row / Card Size

Change row spacing and card sizes in your reports, or let SmartSuite do it automatically.

Search for data in a report

Find

If you're looking for a particular bit of text in your records, you can quickly use the find filter to narrow things down.

Expand a report to view in full screen

Full Screen View

Maximize your SmartSuite real-estate by flipping to full screen mode.

Make The Right Decisions With Smarter Reports

The right data, the right time, the right decisions - start your analysis from anywhere. your potential by visualizing your work.

Free trial - NO Credit Card Required ! 👌