March 2022 Product Updates
This past month marks many product updates with customer needs and requests in mind to continue improving the customization and efficiency of working in SmartSuite. Read on to learn more.
Metric Widgets
Track key metrics, their performance over time, and compare against goals or targets.
Metric widgets provide a visual way to understand your data and analyze aspects of your company’s performance at a glance.
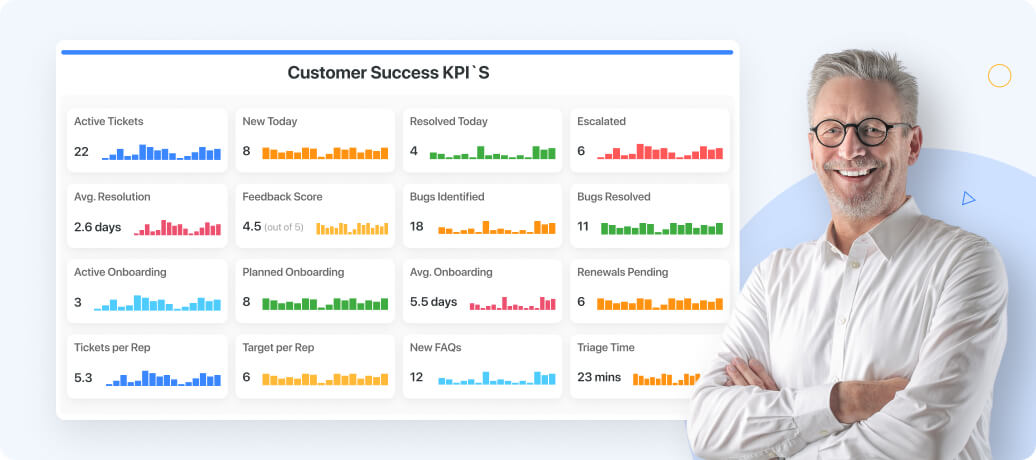
- The Comparison Metric Widget provides a visual snapshot of trends in metrics from one period to the next. The widget is configured by selecting a numeric field that contains the metric’s values along with a date to use in comparing performance over time. The widget can be configured to show data for the last period versus the one before (last quarter versus the prior quarter), or to show performance on a rolling basis (last 7 days versus the prior 7 day period).
- With the Progress Metric widget, you can sum any numeric or currency field in an App, set a goal, and visually track progress toward the goal. Any numeric or currency-based metric can be tracked in the Progress widget, and filters can be applied to the values to support selection of a sub-set of data (only closed opportunities, resolved support cases, and so on).
Chart Enhancements
Bring your SmartSuite Charts to life
SmartSuite’s chart enhancements help your team visualize progress or goals and provide a comprehensive insight about your data- always updated in real time.
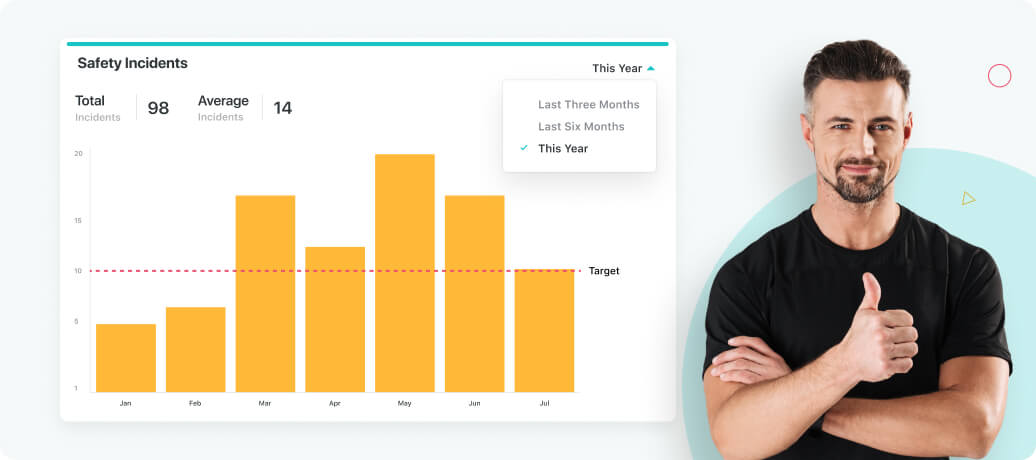
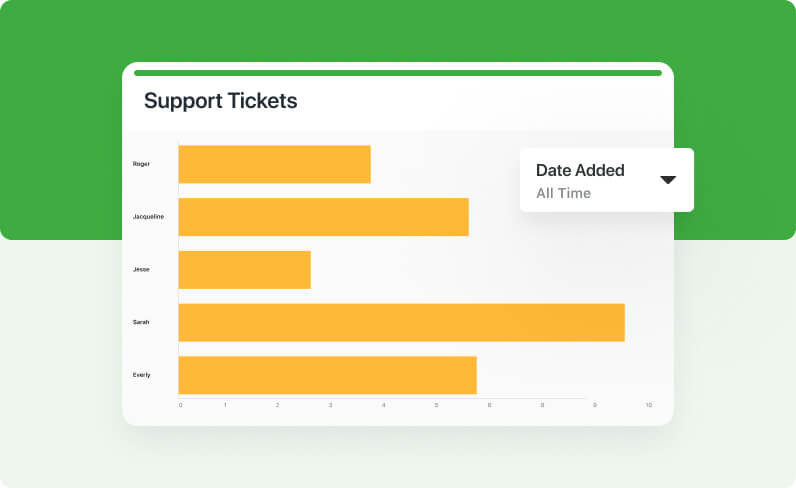
Chart Totals
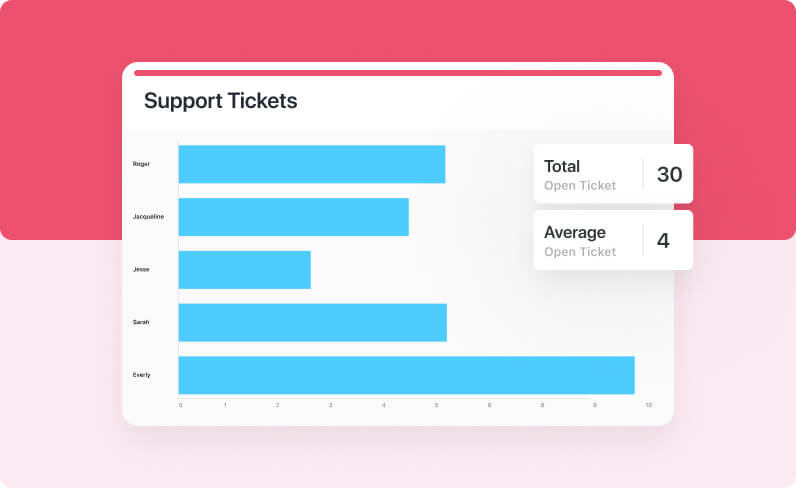
Chart totals allow you to sum any field of data within your chart and display a specific total value. They are useful in visualizing the total value of specific fields directly on your chart or graph.
For example, a software development company could display a running total of the current bugs or support tickets within a data set.
Benchmark Lines
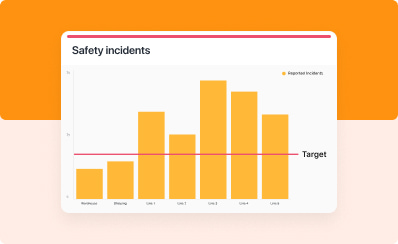
In chart setting, you can input any value to create a Benchmark line on your charts, and then name it accordingly. Benchmark lines help you visualize a standard, target or goal on your charts.
You are able to add up to five different benchmark values and adjust the colors to your preference. Benchmark lines enable you and your company to set performance goals and expectations and visualize your data in relation to them.
Dynamic Filters
Dynamic Filters allow you to create user-configurable filters to narrow down your chart data to examine specific dimensions of your data. To configure a dynamic filter you select the field you would like to filter on. The dynamic filter is displayed to chart viewers, allowing them to select a specific value in the filter to limit the data set to records matching the selected value.
When you configure a dynamic filter using a date field, you give users the ability to display data for all time, the current day, week, or month, the year to date or previous years’ data to drill in to see your data for a specific time period.
Interactive Legends
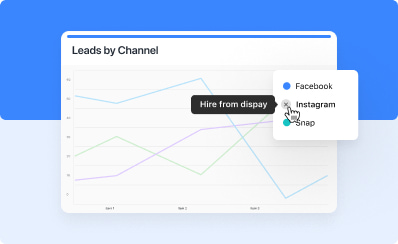
Interactive Legends allow you to control which data series you see on your chart, right from the legend. When first displayed the chart shows users all data series. Clicking on the circle icon in the legend disables the series and removes it from the chart display. This can help users to declutter their view and focus on the specific data elements they’re interested in.
Changes made through the Interactive Legend are not saved, and your chart will return to its original layout when you are done with your session.
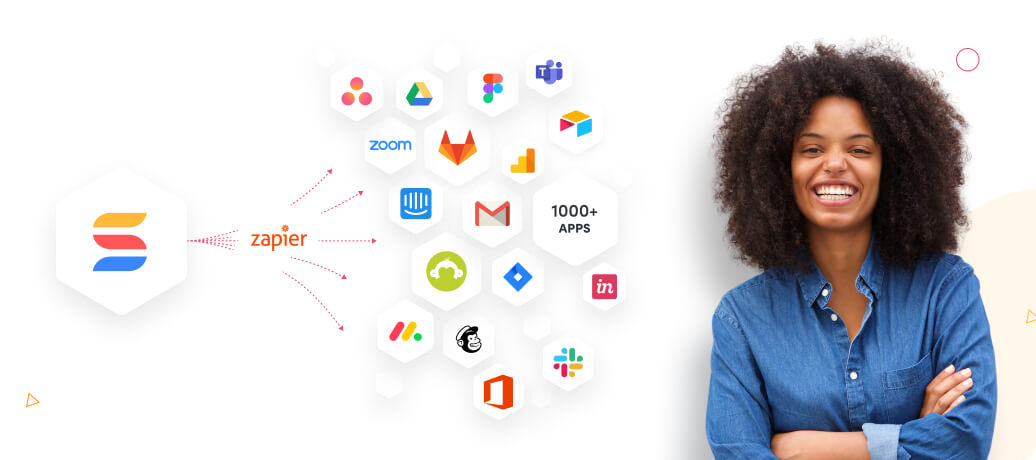
Zapier Connector
Integrate SmartSuite with almost anything
Zapier allows you to connect SmartSuite with thousands of other products in a few simple clicks. Our pre-configured Zap templates allow you start integrating quickly with tools like Jira, Salesforce, Mailchimp and more.
The SmartSuite Zap connector allows you to create triggers based on SmartSuite events (creating or updating records), as well as actions that create new SmartSuite records or update existing ones.
Zapier can support an unlimited set of combinations. You could use a Zap to create a new line in a Google spreadsheet when a record is added in a specific SmartSuite app, or bring leads created in Hubspot in as new records in SmartSuite. Your imagination is the limit!
Auto-Generated Record Titles
Concatenate any fields to a title
This feature allows you to concatenate any fields, within the app you are in, into the Title field.
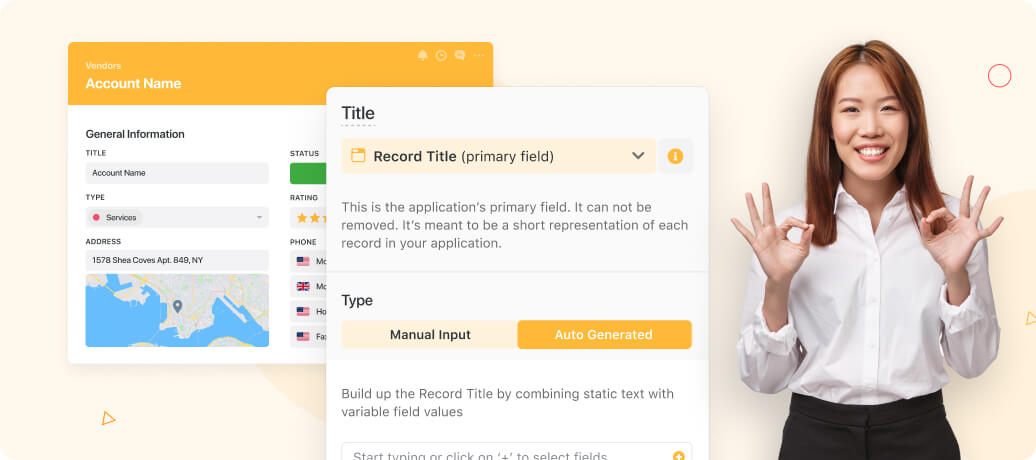
This is great to use when you have a title that has consistency across all records. For example, if a marketing agency has a weekly retainer for several clients. You can simply create an auto-generated title with the date created and the name of the client that the retainer is due for.
Follow these instructions to do this:
- Open the action menu of the title field
- Click 'Modify Field Settings'
- Change the Type of Title to 'Auto Generated'
- Add which fields you want to be included in the Title
- Confirm the switch by clicking 'Yes, I understand'
- Save the record and all the titles of existing records will auto-populate (new records will do the same when created)
Closed Assignments
See all of your completed tasks at a glance.
The My Work panel has been enhanced to include a “Closed Assignments” view, accessed by clicking on the Closed Assignments tab in the top bar.
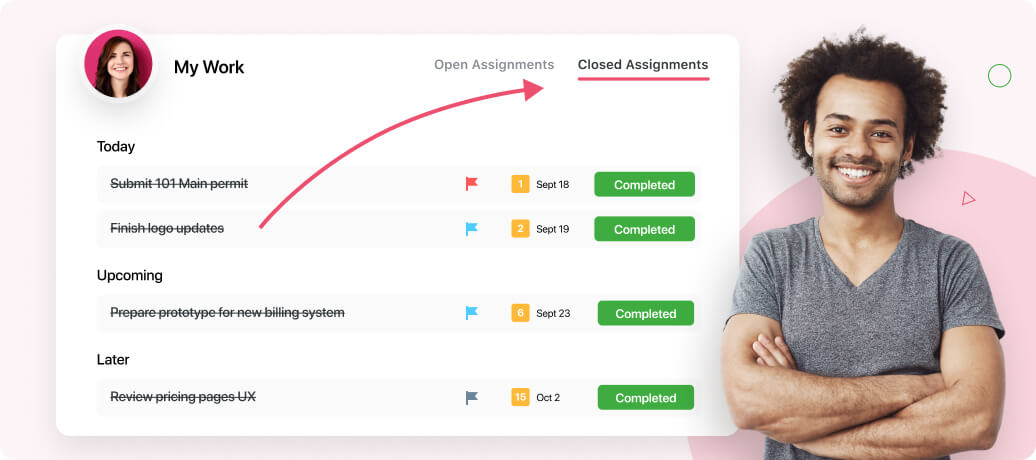
Your completed tasks are grouped into 3 categories:
- Closed Last Week - Every task closed in the last week (including today)
- Closed Last Month - Tasks closed in the last 30 days
- Closed Earlier - All tasks completed more than 30 days ago
Although these tasks are no longer active, the completed task history is always available for reference. Simply click the task’s name to be taken to the personal task, record, assigned comment or checklist item that it is linked to.
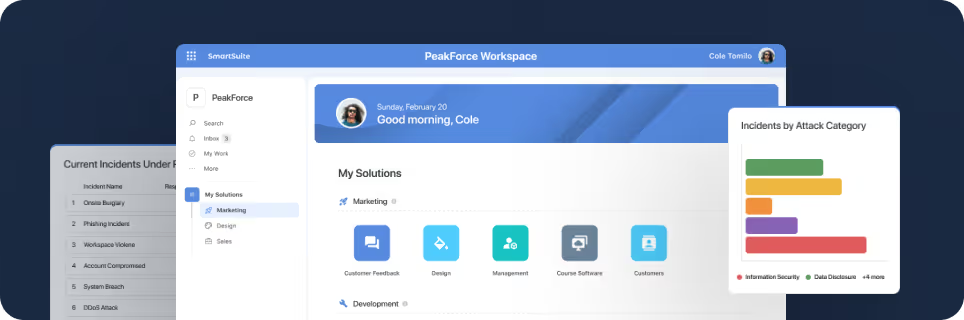
New Solution Templates
Discover our new customer-inspired Solution Templates

We’re always adding to and improving the SmartSuite Solution Template library. Templates are built to support industry best practices and make it easy to streamline new parts of your business.
This month’s new templates support several core business functions including Policy Management, Vendor Management and Risk Management. Our list of integrated risk management templates has also been expanded to include a Corporate and Social Responsibility (sometimes referred to as “ESG”) template to help organizations manage programs that focus on sustainability, ethical business practices, diversity programs and similar initiatives.
SmartSuite provides work platform for standardizing workflows in the following areas:
- Governance, Risk & Compliance
- IT & Service Ops
- Project / Portfolio Management
- Business Operations